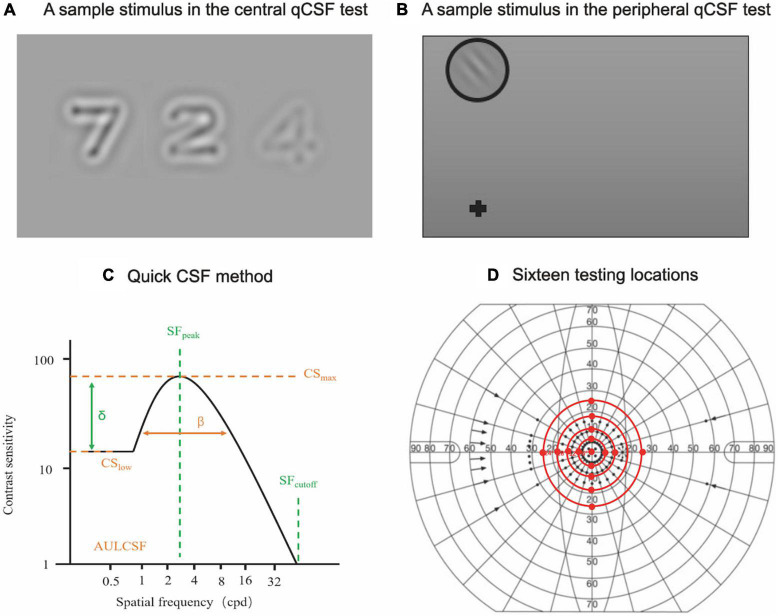
FIGURE 1.
Central and peripheral qCSF measurements. (A) A sample stimulus depicting digits presented on the LCD monitor during the central qCSF test. (B) A sample stimulus presented on the LCD monitor for the peripheral qCSF test. (C) The truncated log-parabola CSF model used in the qCSF paradigm, with four parameters: peak sensitivity (CSmax), peak SF (SFpeak), bandwidth (β), and low-SF truncation (δ) (Barbot et al., 2021). (D) Sixteen testing locations (central and peripheral testing locations, excluding the physiological scotoma) in the peripheral CSF test.

