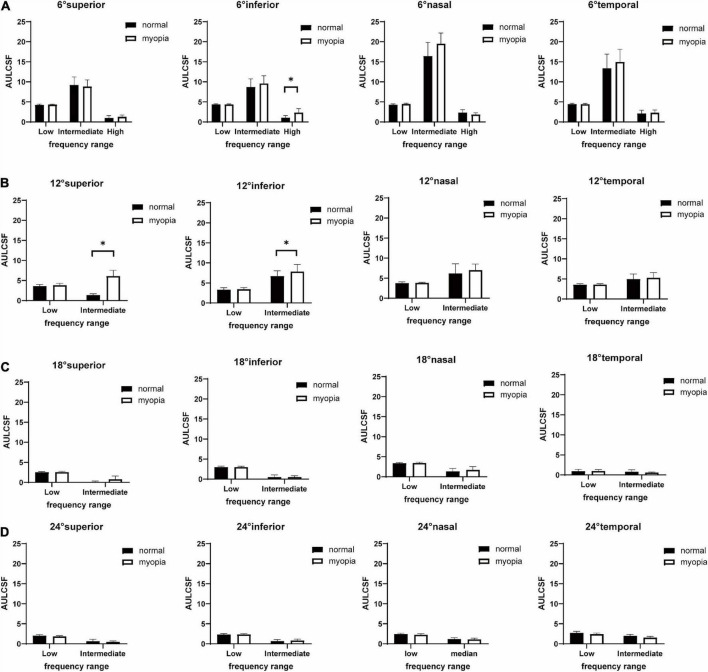
FIGURE 3.
Histographs of low-, intermediate-, and high-SF AULCSFs (Mean ± SD) of myopes and emmetropes at superior, inferior, nasal, temporal visual fields locations at (A) peripheral 6°, (B) peripheral 12°, (C) peripheral 18°, (D) peripheral 24°. The plot shows the mean and 95% confidence limits. The white columns denote the myopia group and the black columns denote the normal group. Significant differences (*P < 0.05, Post-hoc Bonferroni test) between myopes and emmetropes are indicated by a (*).

