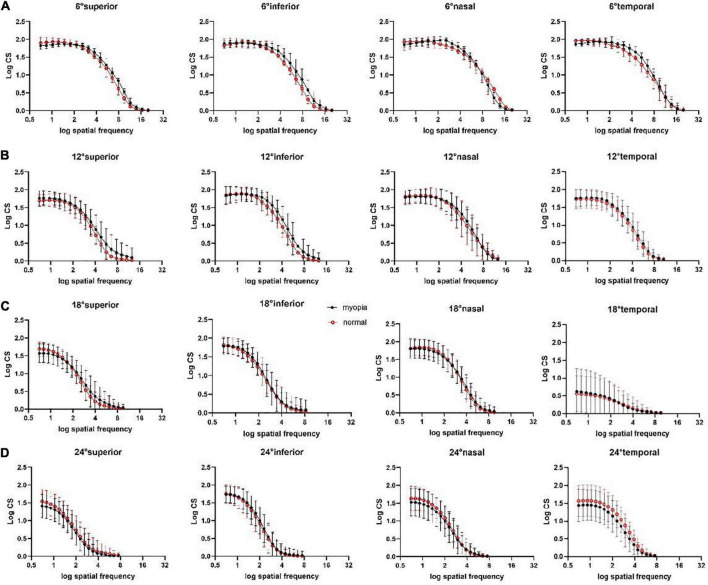
FIGURE 4.
Peripheral CSFs at superior, inferior, nasal, temporal visual field locations at (A) peripheral 6°, (B) peripheral 12°, (C) peripheral 18°, (D) peripheral 24°. Each curve represents the fit of second-order polynomials to the average observed CSF. The middle points of the vertical line segments denote the mean log CS values; the top and bottom of the vertical line segments represent the 25th and 75th percentile values.

