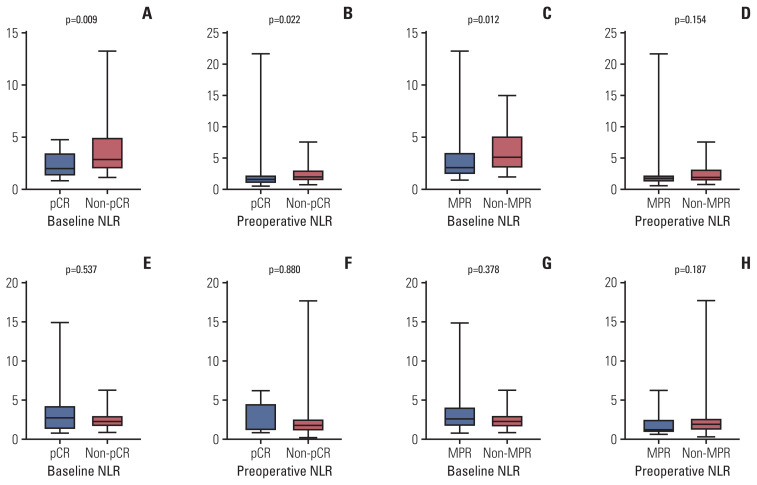
Fig. 2.
The correlations between baseline and preoperative neutrophil-to-lymphocyte ratio (NLR) and pathological responses. (A–D) Neoadjuvant chemotherapy combined with programmed death-1 (PD-1) checkpoint inhibitors group. (A) The difference of baseline NLR between pathological complete response (pCR; mean±standard deviation, 2.39±1.19) and non-pCR (3.60±2.27) patients (p=0.009). (B) The difference of preoperative NLR between pCR (2.33±3.84) and non-pCR (2.32±1.30) patients (p=0.022). (C) The difference of baseline NLR between major pathologic response (MPR; 2.76±2.15) and non-MPR (3.55±1.86) patients (p=0.012). (D) The difference of preoperative NLR between MPR (2.35±3.33) and non-MPR (2.30±1.33) patients (p=0.154). (E–H) Neoadjuvant chemotherapy alone group. (E) The difference of baseline NLR between pCR (3.98±4.56) and non-pCR (2.48±1.11) patients (p=0.537). (F) the difference of preoperative NLR between pCR (2.50±2.04) and non-pCR (2.29±2.21) patients (p=0.880). (G) The difference of baseline NLR between MPR (3.52±3.60) and non-MPR (2.45±1.12) patients (p=0.378). (H) The difference of preoperative NLR between MPR (2.03±1.72) and non-MPR (2.36±2.26) patients (p=0.187).

