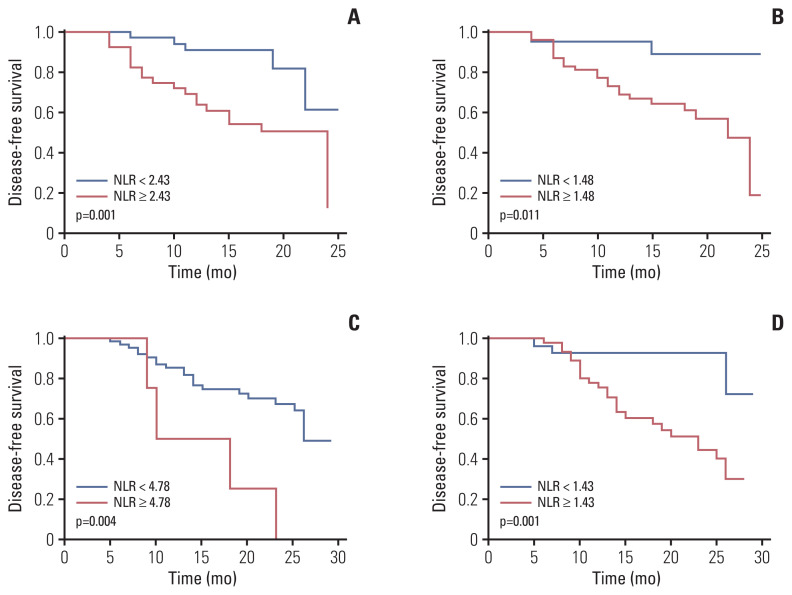
Fig. 3.
Kaplan-Meier analysis of disease-free survival in relation to neutrophil-to-lymphocyte ratio (NLR). Kaplan-Meier curves for disease-free survival (DFS). (A) DFS curve of patients with baseline NLR in neoadjuvant chemotherapy combined with programmed death-1 (PD-1) checkpoint inhibitors group (p=0.001). (B) DFS curve of patients with preoperative NLR in neoadjuvant chemotherapy combined with PD-1 checkpoint inhibitors group (p=0.011). (C) DFS curve of patients with baseline NLR in neoadjuvant chemotherapy alone group (p=0.004). (D) DFS curve of patients with preoperative NLR in neoadjuvant chemotherapy alone group (p=0.001).

