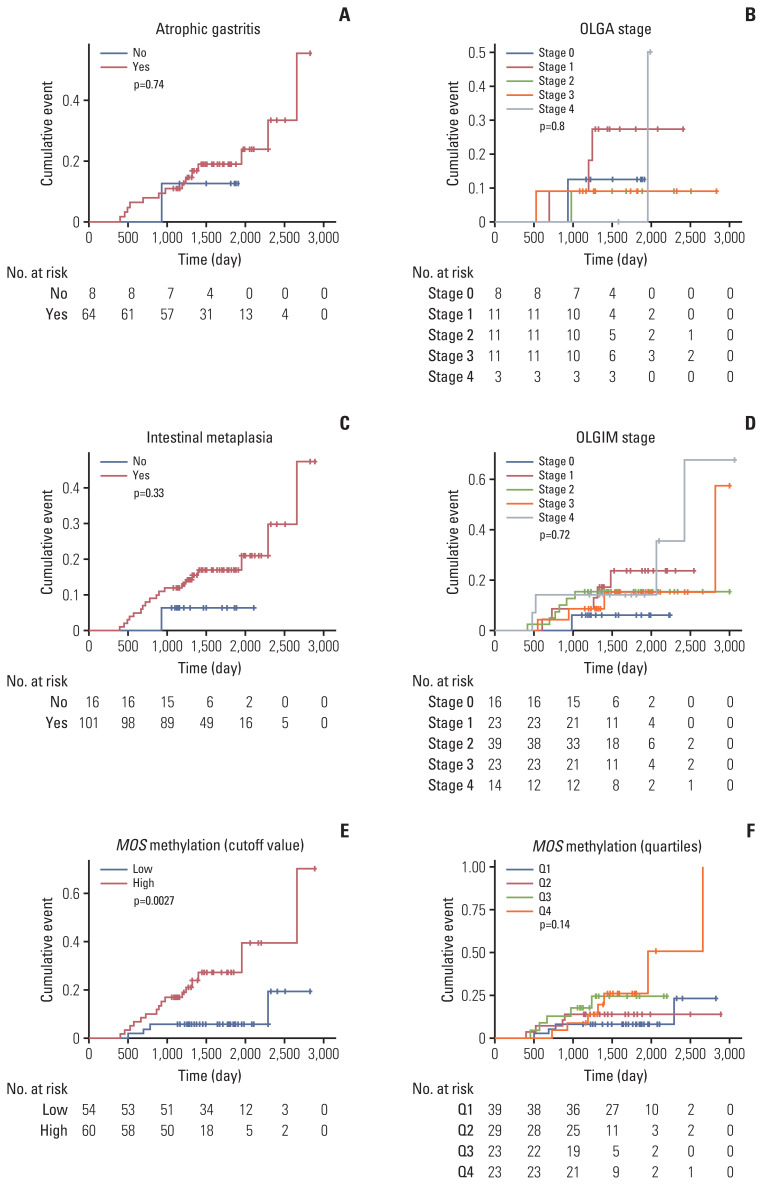
Fig. 3.
Kaplan-Meier curves for cumulative incidences of metachronous recurrence according to atrophic gastritis (A), OLGA stage (B), intestinal metaplasia (C), OLGIM stage (D), MOS methylation status (E, F, n=124). Atrophic gastritis and intestinal metaplasia were defined as the presence of histologic atrophy (score 1–3) and intestinal metaplasia (score 1–3), respectively, at either antrum or corpus by the updated Sydney scoring system. The cutoff value (35.82%) of high or low level of MOS methylation was determined by receiver operating characteristic curve analysis. OLGA, operative link on gastritis assessment; OLGIM, operative link on gastric intestinal metaplasia assessment.

