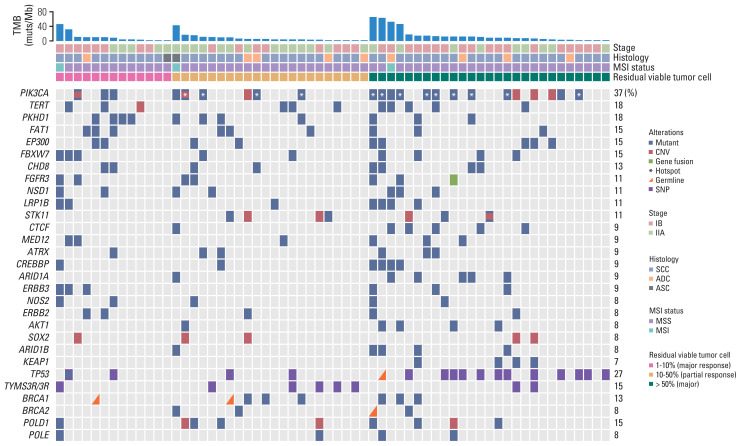
Fig. 1.
Distribution of gene alterations correlated with pathologic response. Gene alterations and patient clinical characteristics were shown at the top and bottom, respectively. Patients were separated into three groups, of which H&E stains exhibited < 10%, 10%–50% and 50%–100% viable tumor cells. The BRCA1/2, POLD1, and POLE were genes related to targeted therapy or immunotherapy. PIK3CA hotspot mutations on E542, E545, and H1047 were marked by white asterisks. The 0%–10%, 10%–50%, and 50%–100% viable tumor cells represent major, partial and poor pathologic response, respectively. ADC, adenocarcinoma; ASC, adenosquamous carcinoma; CNV, copy number variation; MSI, microsatellite instability; MSS, microsatellite stability; SCC, squamous cell carcinoma; SNP, single nucleotide polymorphism; TMB, tumor mutation burden.

