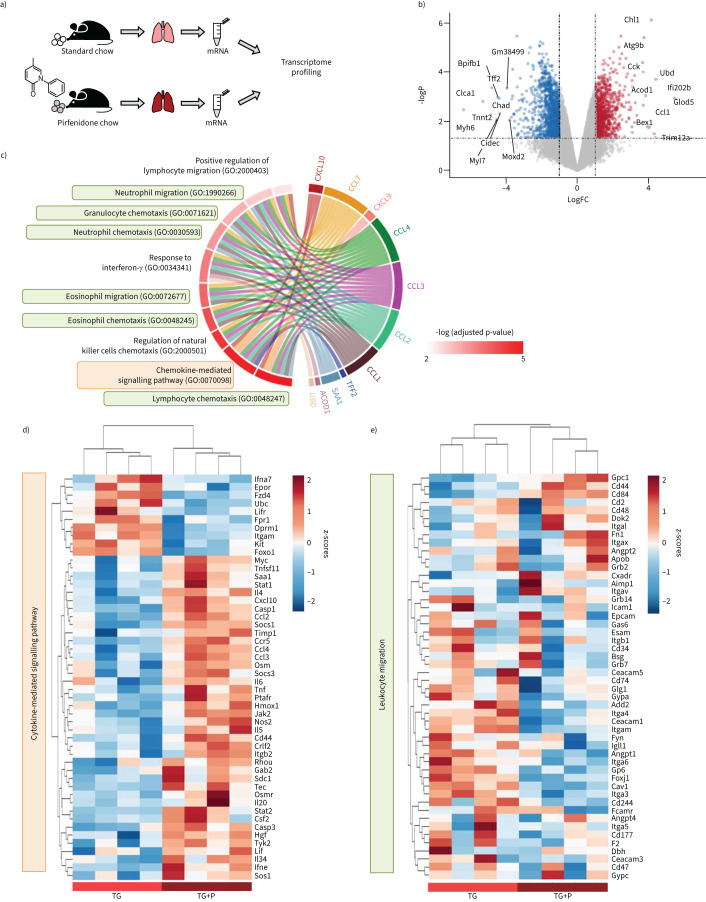
FIGURE 3.
Transcriptomic profiling highlights inflammatory pathways upregulated upon pirfenidone treatment in Fra-2-overexpressing transgenic (Fra-2 TG) mice. a) Schematic representation of the experimental setup. b) Volcano plot showing differential gene regulation in Fra-2 TG mouse lungs with (+P) and without pirfenidone. Top 10 regulated genes according to their log-fold-change (logFC) are labelled by name. c) Top 10 significantly regulated gene ontologies (GO biological process) and their significantly regulated genes within the dataset. d and e) Heatmap representation with hierarchical clustering of genes within the gene ontologies d) GO:0019221 cytokine-mediated signalling pathway and e) GO:0050900 leukocyte migration.

