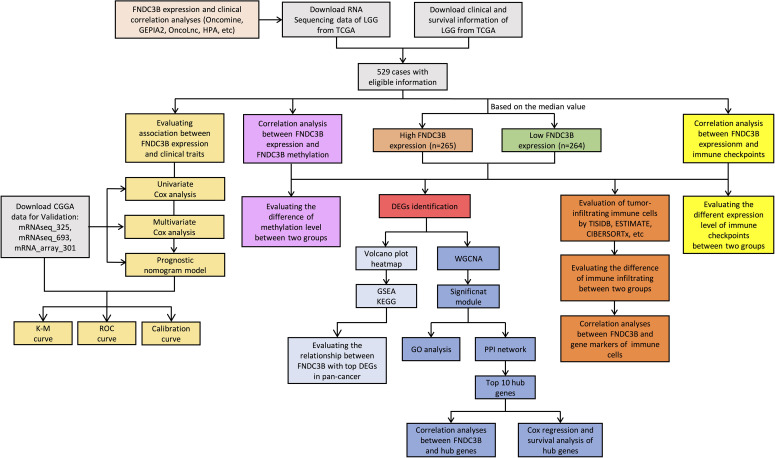
Figure 1.
Flowchart of this study: data collection, processing, analysis, and validation. LGG, low-grade glioma; TCGA, The Cancer Genome Atlas; CGGA, Chinese Glioma Genome Atlas; GEPIA2, gene expression profiling interactive analysis 2; HPA, Human Protein Atlas; K-M, Kaplan-Meier; ROC, receiver operating characteristic; DEGs, differentially expressed genes; WGCNA, weighted gene co-expression network analysis; GSEA, gene set enrichment analysis; KEGG, kyoto encyclopedia of genes and genomes; GO, gene ontology; PPI, protein-protein interaction.

