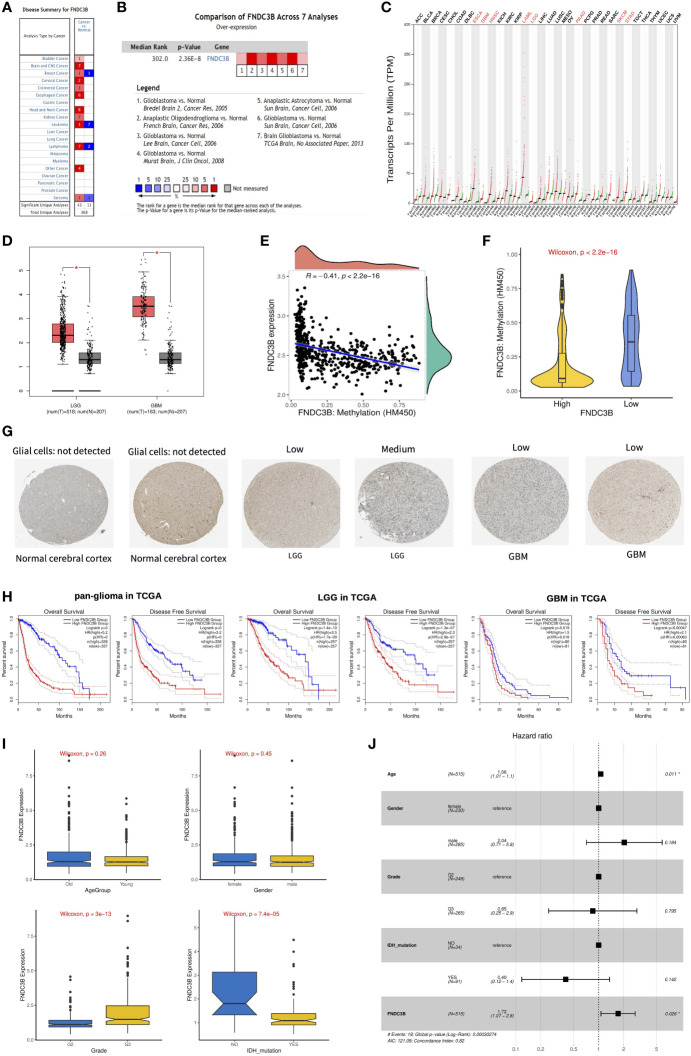
Figure 2.
The expression profiles and prognostic value of FNDC3B in glioma. (A) In brain and CNS cancers, FNDC3B was significantly upregulated in seven studies. Red represents high expression and blue represents low expression. The darker the red color, the higher the gene expression level. The darker the blue color, the lower the gene expression level. (B) Comparison of FNDC3B expression across seven analyses, and red represents high expression. (C) FNDC3B was significantly upregulated in various tumors. (D) Expression level of FNDC3B in LGG and GBM compared to control. *, P < 0.05. (E) The expression of FNDC3B was negatively regulated by FNDC3B DNA methylation. (F) Different methylation levels of FNDC3B in the FNDC3B high- and low-expression groups in TCGA LGG samples. (G) Representative FNDC3B protein expression in normal and glioma tissues. Data were obtained from the Human Protein Atlas (HPA). (H) Kaplan-Meier analysis of OS and DFS based on FNDC3B high- vs. low-expression in pan-glioma, LGG, and GBM patients in the TCGA dataset. Red curve represents patients with high expression of FNDC3B, and blue curve represents low FNDC3B. (I) The correlations between FNDC3B expression and clinical characteristics based on TCGA LGG datasets: age, gender, grade, and isocitrate dehydrogenase (IDH) status. (J) Multiple Cox regression analysis of clinicopathological features (including FNDC3B expression) and OS in the TCGA LGG datasets.

