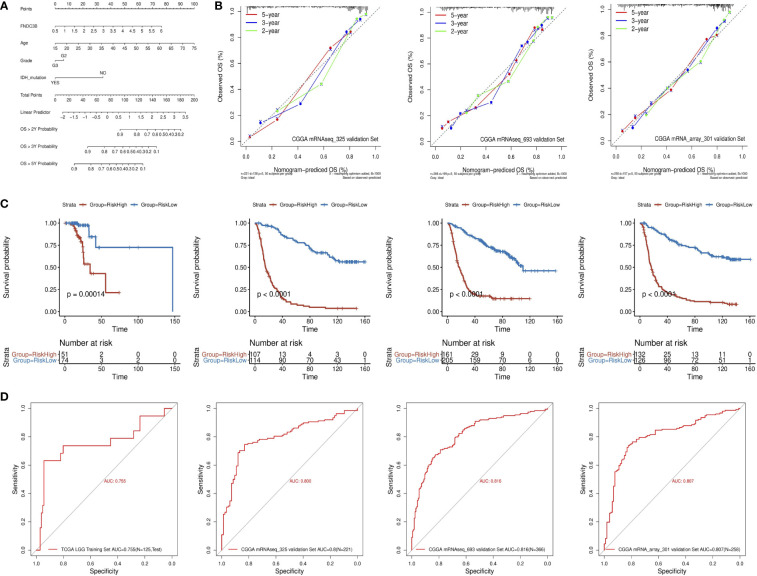
Figure 3.
Construction and validation of the prognostic nomogram. (A) Prognostic nomogram for TCGA low-grade glioma (LGG) dataset. According to four variables (FNDC3B expression level, age, grade, and IDH status) in the model, four corresponding ‘points’ values can be obtained, and the ‘total points’ can be calculated by summing them. Therefore, the 2-/3-/5-year overall survival (OS) rate of patients can be predicted. (B) The calibration curves for predicting 2-/3-/5-year OS in the CGGA_325, CGGA_693, and CGGA_301 validation datasets, respectively. The nomogram-predicted probability of survival and actual survival are plotted on the x- and y-axes, respectively. The diagonal line represents a perfect prediction. (C) K-M curve of high-risk (red) and low-risk (blue) for TCGA low-grade glioma (LGG) training, CGGA_325, CGGA_693, and CGGA_301 validation datasets. (D) ROC curves for the risk score in the TCGA LGG training, CGGA_325, CGGA_693, and CGGA_301 validation datasets. TCGA, The Cancer Genome Atlas; CGGA, Chinese Glioma Genome Atlas.

