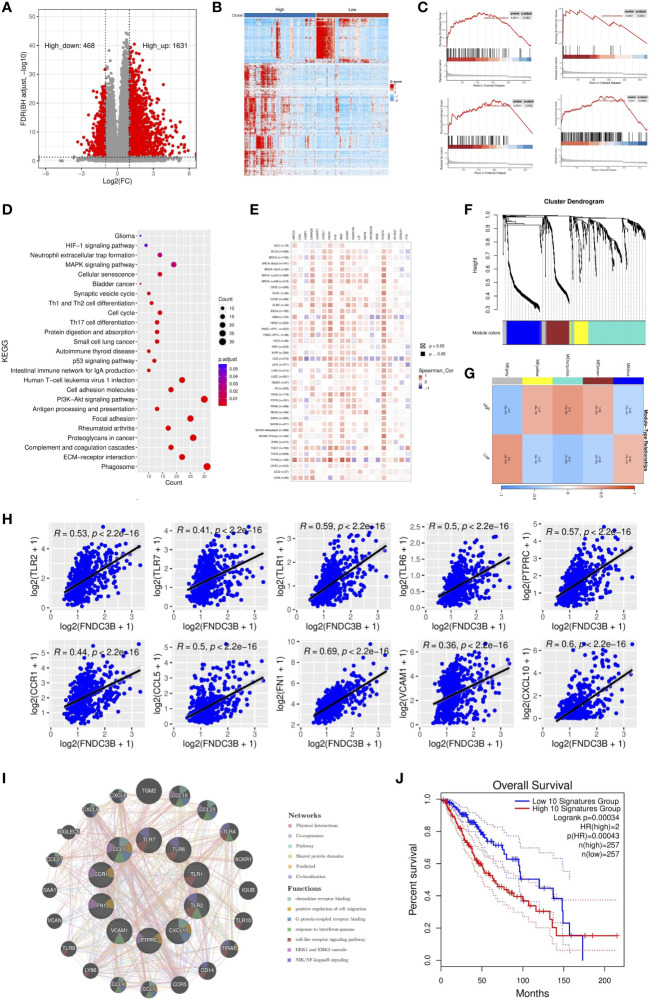
Figure 4.
Identification and enrichment analysis of differentially expressed genes (DEGs) in TCGA low-grade glioma (LGG). (A) Volcano plot of all DEGs. (B) Heatmap of the 547 filtered DEGs. (C) Gene set enrichment analysis (GSEA) showed that FNDC3B is involved in the tumor immune microenvironment. (D) Kyoto encyclopedia of genes and genomes (KEGG) pathway analyses of DEGs. (E) The correlation heatmap between FNDC3B with 20 DEGs in pan-cancer. TCGA: The Cancer Genome Atlas. (F) Co-expression network constructed with weighted gene co-expression network analysis (WGCNA), hierarchical clustering tree for DEGs based on a dissimilarity measure (1-TOM), genes with similar expression patterns were merged into the same module. (G) Correlation between modules and FNDC3B expression. The upper number in each grid represents the correlation coefficient of each module, and the lower number is the corresponding P-value. (H) Relationship of the expression level between the top 10 hub genes and FNDC3B. (I) GeneMANIA database analysis shows the interaction network among hub genes. Each node represents a gene. The node size displays the strength of interactions. The line color indicates the types of interactions and the node color represents the possible functions of each gene. (J) The survival times of TCGA low-grade glioma (LGG) patients with the highest and lowest expression of the top 10 hub genes were compared.

