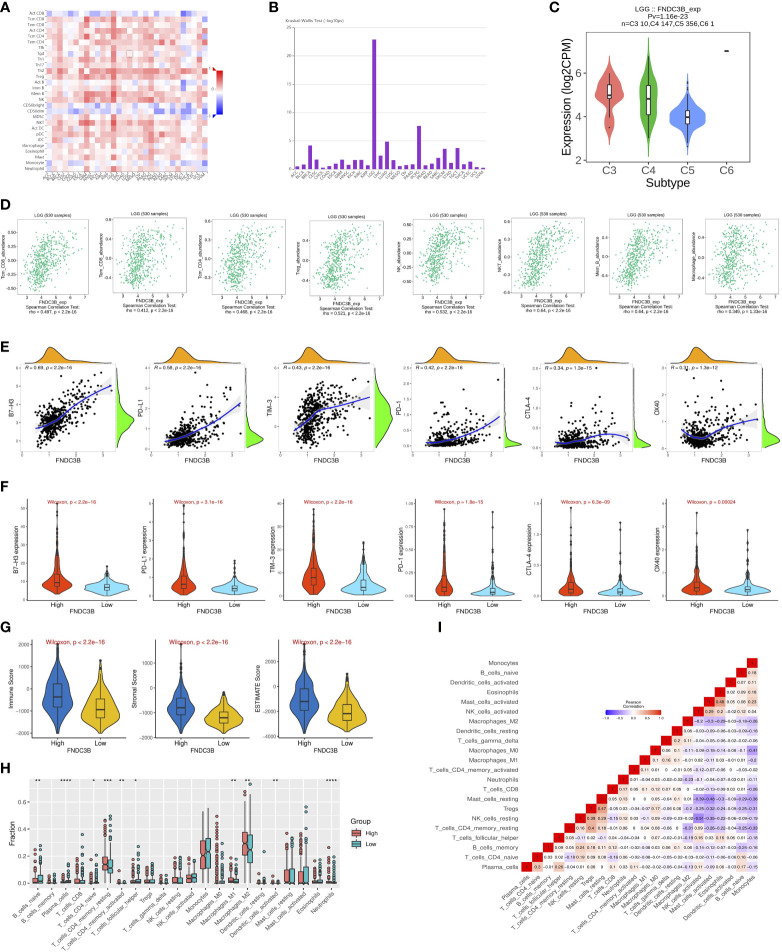
Figure 5.
Correlation of FNDC3B expression with immune infiltration level in pan-cancer and TCGA low-grade glioma (LGG). (A) The landscape of correlation between FNDC3B expression and tumor-infiltrating lymphocytes (TILs) in pan-cancer (red is positive correlated and blue is negatively correlated). (B) Associations between FNDC3B expression and immune subtypes across human cancers. (C) Correlation of FNDC3B expression and immune subtypes in low-grade glioma (LGG). C3: inflammatory; C4: lymphocyte depleted; C5: immunologically quiet; C6: TGF-b dominant. (D) FNDC3B expression was positively closely related with infiltrating levels of central memory CD8 T cells, effector memory CD8 T cells, central memory CD4 T cells, regulatory T cells, natural killer cells, natural killer T cells, memory B cells, and M1 and M2 macrophages in LGG and glioblastoma multiforme (GBM). (E) The correlation between FNDC3B and immune checkpoint molecules (B7-H3, PD-L1, TIM-3, PD-1, CTLA-4, and OX40). (F) Different expression levels of the six immune checkpoint genes in the high and low FNDC3B expression groups in TCGA LGG samples. (G) Comparison of immune, stromal, and ESTIMATE scores between the FNDCB high- and low-expression groups. (H) Different proportions of 22 subtypes of immune cells in the FNDCB high- and low-expression groups in TCGA LGG dataset by CIBERSORTx. The proportions of naive B cells (P < 0.01), plasma cells (P < 0.0001), naive CD4 T cells (P < 0.05), resting memory CD4 T cells (P < 0.001), activated memory CD4 T cells (P < 0.01), follicular helper T cells (P < 0.05), macrophages M1 (P < 0.01), macrophages M2 (P < 0.01), dendritic cells activated (P < 0.01), neutrophils (P < 0.0001). *P < 0.05, **P < 0.01, ***P < 0.001, ****P < 0.0001. (I) Correlation matrix heatmap of 22 immune infiltration cells in LGG samples.

