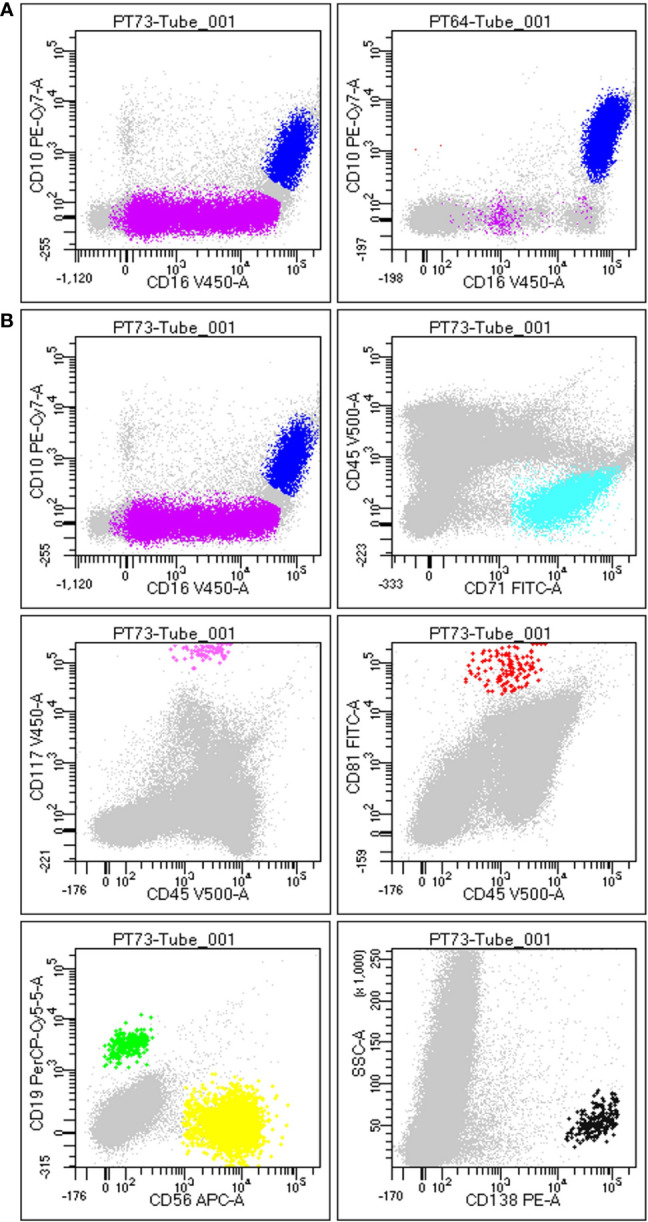
Figure 1.

Gating strategy to define BM population. (A) Difference between a non-hemodiluted sample (left) and a hemodiluted sample (right), as shown by the presence of both immature (purple) and mature granulocytes (blue): the maturation line of granulocytes (including promyelocytes, myelocytes and metamyelocytes) is highlithed in purple and is highly present in nonHD samples (on the left), wherease it is almost absent in HD samples (on the right). (B) Each plot is the result of the different gating strategies used to define different populations, according to FSC/SSC and the specific markers. In details, plot 1 displays immature (SSC++/FSC++; CD45dim/+/CD16low/CD10neg) and mature granulocytes (SSC++/FSC++; CD45dim/+/CD10+/CD16+), plot 2 shows erythroblasts (SSClow/FSClow; CD45neg/CD71+), plot 3 displays mast cells (SSC++/FSC++; CD45dim/CD117hi), plot 4 exhibits hematogones (SSClow; CD45dim/CD10+/CD81hi), plot 5 shows B-cells (SSClow; CD45hi/CD19+/CD56neg) and T-cells (NK-like T-cells/NK; SSClow; CD45hi/CD19neg/CD56hi), and plot 6 displays plasma cells (SSClow/FSC+; CD138hi).
