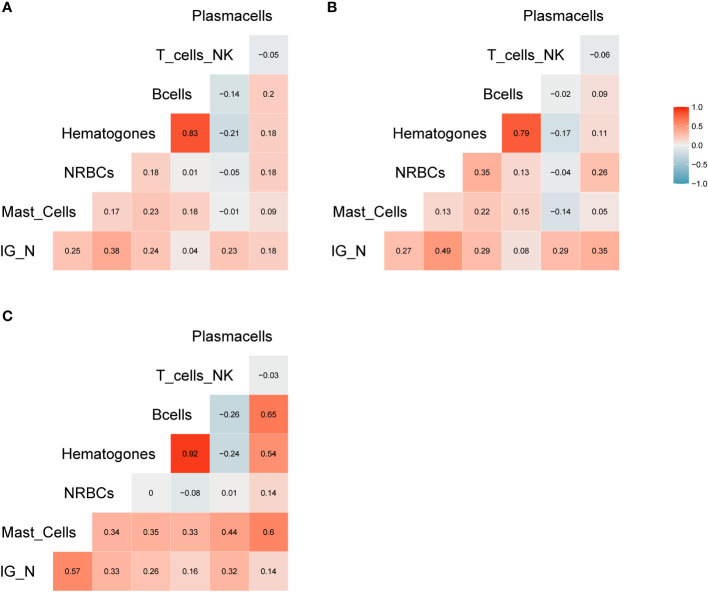
Figure 2.
Correlation analysis. (A) Correlation matrix related to all samples included in the study; the relative matrices for MM (B) and ALL patients (C). Positive correlations are displayed in red, while negative correlations are displayed in blue. Color intensity is defined by the correlation coefficient. Overall, the Pearson’s rho (R) for IG/N vs. mast cells and erythroblasts was ~0.3, with p<0.0006.

