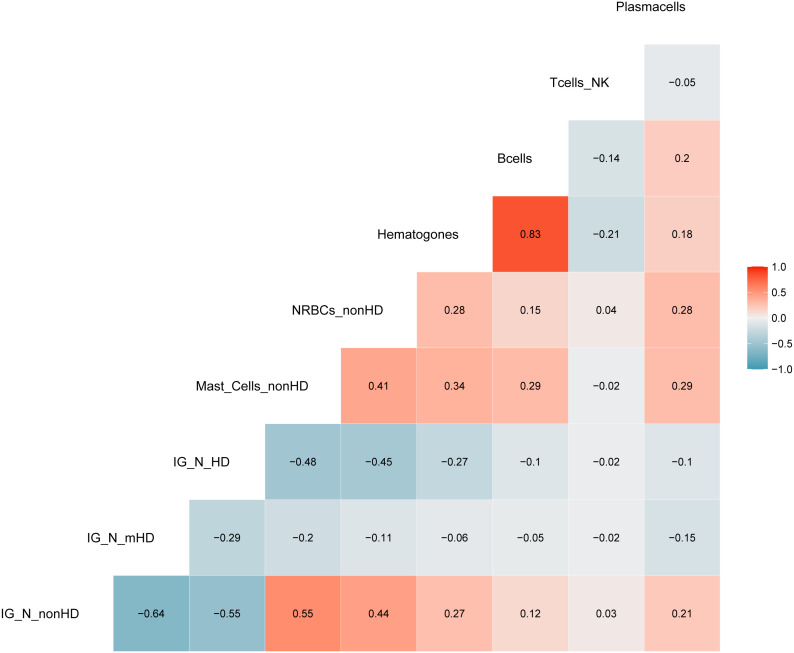
Figure 3.
Correlation analysis with categorized parameters. Positive and negative correlations are presented in red and blue, respectively. Correlation coefficients are related to the color intensity. Once defined the cut-offs for the three parameters (IG/N, mast cells and erythroblasts (nucleated red blood cells, NRBCs), a higher correlation was observed between these categorized variables as compared to the same continuous variables shown in Figure 2 .

