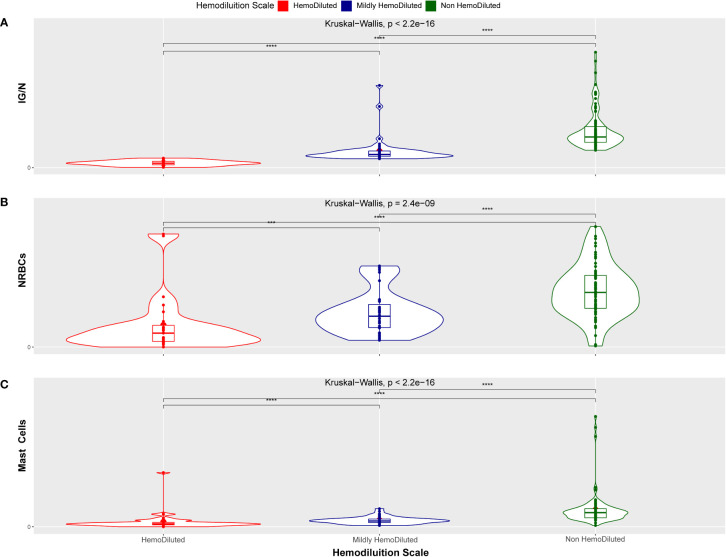
Figure 5.
Kruskal-Wallis distribution. Hemodiluted (HD, red), mildly hemodiluted (mHD, blue) and non-hemodiluted (non-HD, green) sample distribution related to the IG/N ratio (A), to the erythroblasts (nucleated red blood cells, NRBCs) (B) and to the mast cells presence (C). The distribution between groups has a p-value inferior to 2.4e10-9, indicating a statistically highly significant tendency. (***p < 0.0005 and ****p < 0.00005).

