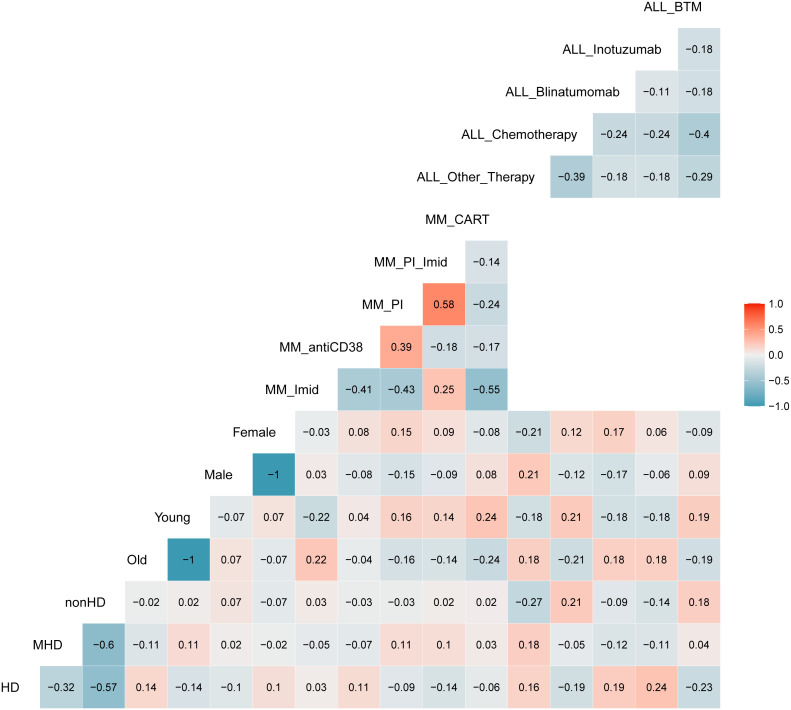
Figure 6.
Correlation matrix between ALLgorithMM-defined BM hemodiluted (HD), mildlyHD (mHD) and non-hemodiluted (nonHD) vs. age (old or young), gender (female or male) and therapy used at the time of the sampling. Blue and red stand for negative or positive correlations, respectively. Color intensity is proportional to the correlation coefficients. The figure shows an absence of correlation between the 3 HD groups and others variables, confirming the robustness of the ALLgorithMM.

