Figure 7.

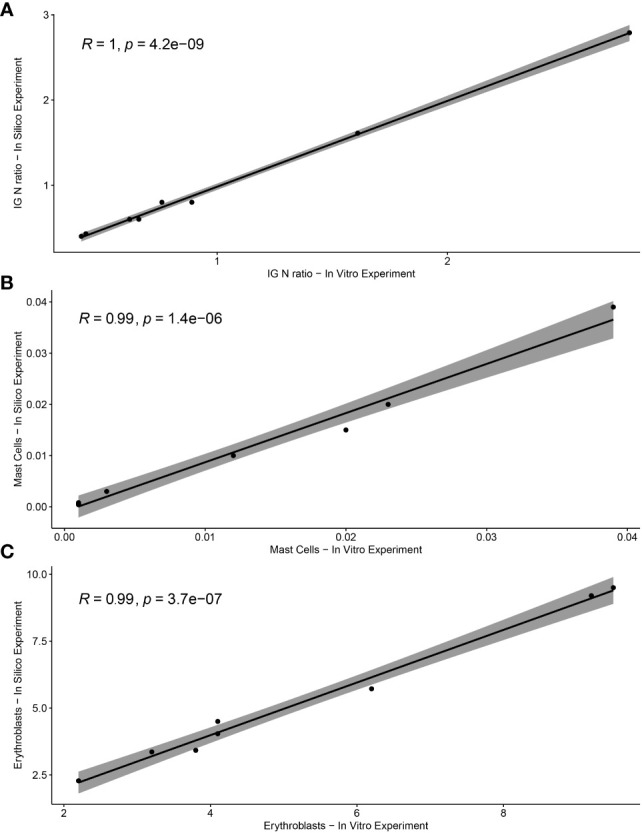
Correlation between in vitro and in silico-calculated data of ALLgorithMM parameters. The Pearson’s rho (R) accompanied by the relative p-value for (A) IG/N ratio, (B) mast cells, and (C) erythroblasts.

Correlation between in vitro and in silico-calculated data of ALLgorithMM parameters. The Pearson’s rho (R) accompanied by the relative p-value for (A) IG/N ratio, (B) mast cells, and (C) erythroblasts.