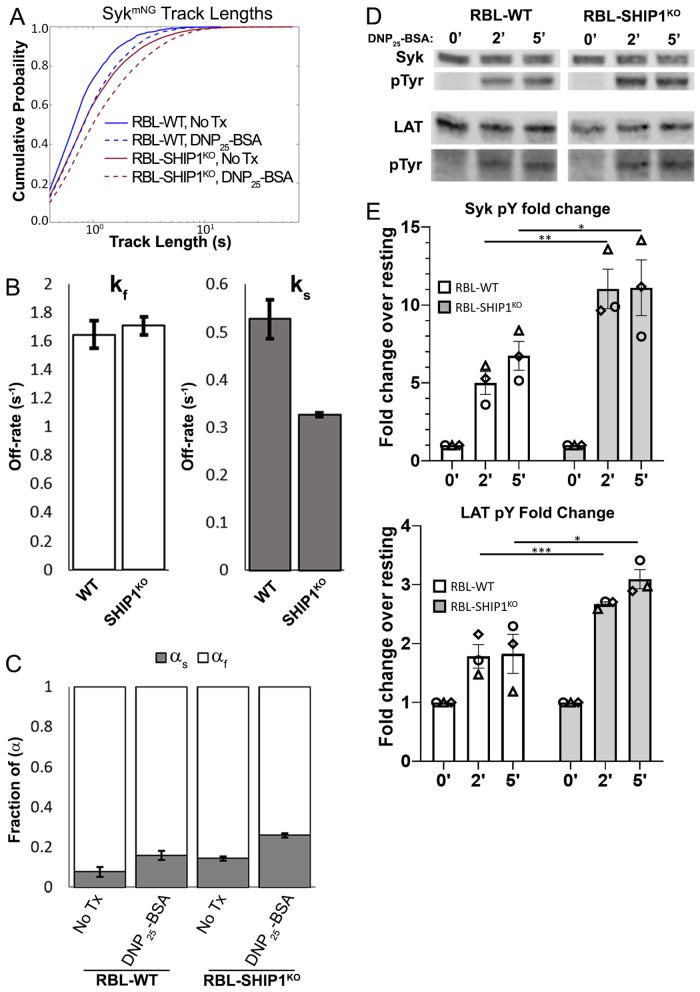
FIGURE 8:
SHIP1 acts to reduce Syk binding duration and activity at the plasma membrane. (A) Cumulative probability distributions of trajectory lengths (membrane residency time) for Syk-mNG before (solid lines) and 1–5 min after (dashed lines) addition of 0.1 µg/ml DNP25-BSA, for RBL-WT (blue) and RBL-SHIP1KO (red) cells. Number of trajectories (n): No Tx WT n = 1040, +DNP-BSA WT n = 5129, No Tx SHIP1KO n = 8071, +DNP-BSA SHIP1KO n = 15661. Data collected from at least 20 cells per condition over 3 d. (B) The fast (kf) and slow (ks) off-rates calculated for Syk-FcεRI interactions in each cell type. (C) The fraction of slow (αs) and fast (αf) Syk-mNG interactions both before and after DNP25-BSA cross-linking. Values in B and C are from fitting of data in A as described in Materials and Methods. Error bars are a 68% credible interval. (D) Representative immunoblot of Syk and LAT phosphorylation in RBL-WT or SHIP1KO cells. Cells were treated with 0.1 µg/ml DNP25-BSA for the indicated time points and probed for total protein and phosphorylation of Syk (top) and LAT (bottom). Three independent experiments were performed. (E) Quantification of Western blots as described in D for Syk (top plot) and LAT (bottom plot) phosphorylation, *** P < 0.001, ** P < 0.01, * P < 0.05. ANOVA with Šídák’s multiple comparison test. Bar graphs display average values ± SD from three independent experiments, and matching symbols indicate results from the same individual experiment.

