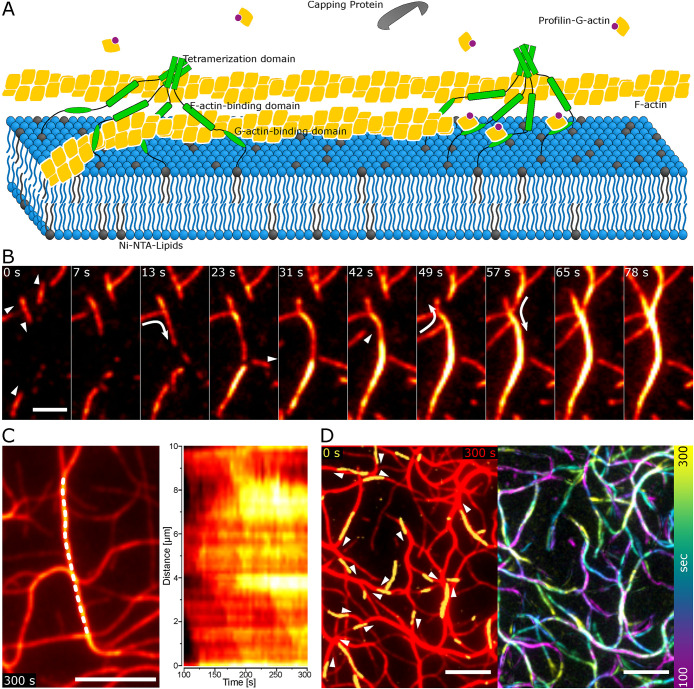
FIGURE 1:
Alignment during polymerization of actin elongated by VASP. (A) Experimental setup of actin polymerized by VASP on supported lipid bilayers. Actin is visualized with 12.5% of actin labeled with Atto488. (B) TIRFM images show actin filament alignment to bundles by 50 nM VASP (scale bar 2 µm). The triangles indicate the direction of polymerization and the arrows display alignment events to a bundle. (C) Kymograph (right) of a newly formed bundle marked by the dashed line at 5 min of polymerization in the left panel (scale bar 5 µm) shows mixed orientation of filaments during polymerization. (D) The first frame (yellow) and the direction of polymerization indicated by the triangles, overlaid over the network at 5 min (red) on the left and the temporal color-coded actin intensity increase on the right, illustrate the bundle network formation from actin seeds and subsequent elongation at the existing filaments (scale bar 5 µm).

