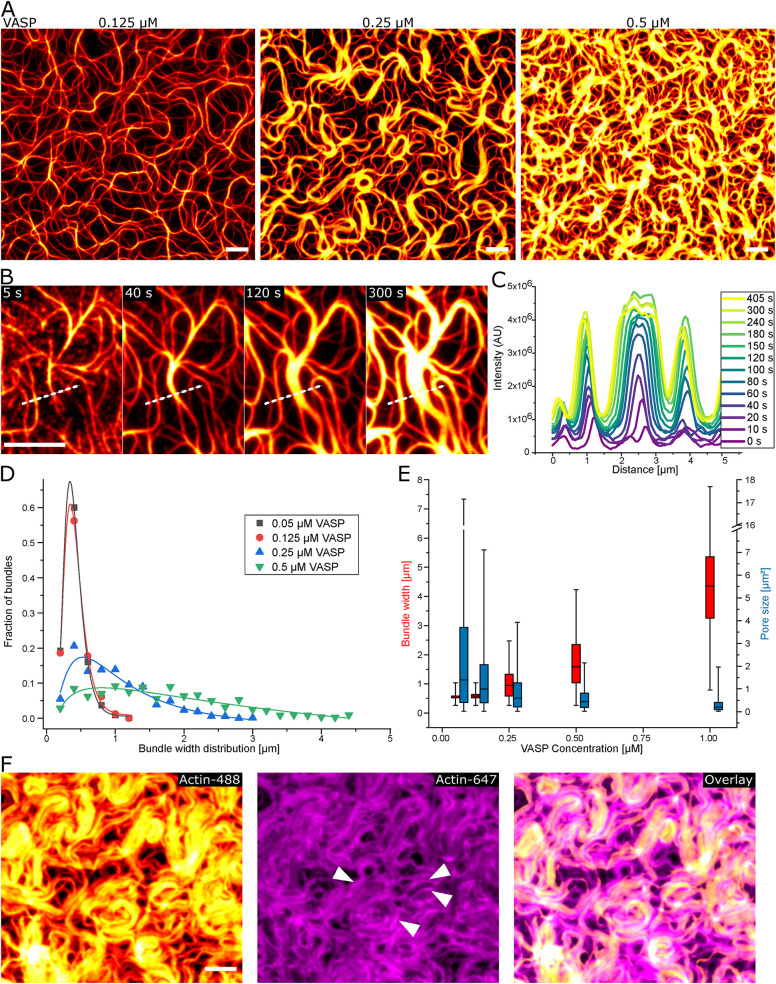
FIGURE 2:
Bundle thickening by elongation at the bundle borders. (A) On supported lipid bilayers, actin bundles increase in size in a VASP concentration (0.125, 0.25, 0.5 µM)-dependent manner. Continuous growth of filaments at existing bundles is visible, with swelling of bundles at 0.25 µM VASP (B) and the corresponding intensity profile (C) indicated by the dashed line in (B). (D) Histogram of the bundle width distribution at different VASP concentration with a log-normal fit of the distribution. (E) Box plot of bundle width and pore size showing the median, 25–75th percentile range as boxes and 1–99th percentile range as whiskers. (F) At 1 µM VASP, the exchange of the actin-Atto488 to actin-Atto647 (0.5 µM) after 3 min exhibits the incorporation at the sides of big bundles (indicated by arrows). All scale bars are 5 µm.

