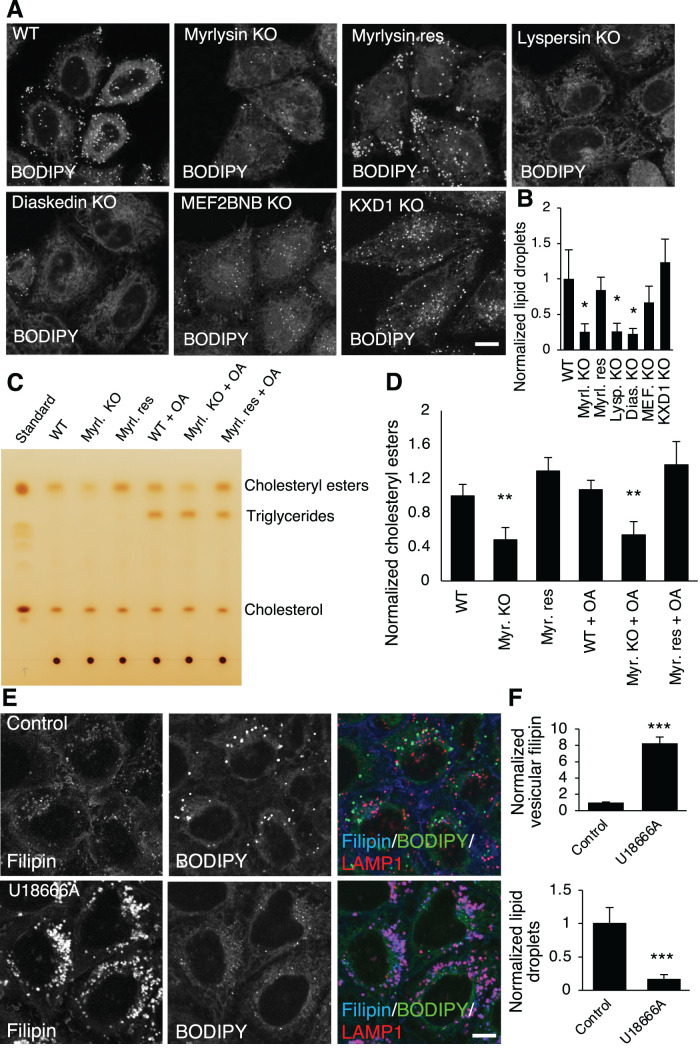
FIGURE 2:
BORC-subunit KO decreases cellular cholesteryl esters. (A, B) WT, BORC-subunit-KO, and myrlysin-rescued HeLa cells were stained with the LD dye BODIPY493/503 (BODIPY). Live-cell imaging was performed, and BODIPY signals were quantified (n = 104, 83, 125, 114, 74, 68, and 65) and normalized to the intensity in WT cells. Myrl., myrlysin; Lysp., lyspersin; Dias., diaskedin; MEF., MEF2BNB. (C, D) Cell lysates were prepared from WT, myrlysin-KO (Myrl. KO), and myrlysin-rescued (Myrl. Res) cells treated with/without 0.3 mM OA for 3 h, and the total lipids were extracted from the lysates and subjected to TLC. Standard samples of cholesterol esters, triglycerides, and cholesterol were used to identify the bands. The intensity of cholesterol esters was quantified from three independent experiments and normalized to the intensity in WT untreated cells. (E, F) HeLa cells were treated with/without 1 μM of the NPC1 inhibitor U18666A for 16 h and fixed for staining with filipin, BODIPY, and LAMP1 antibody. The intensities of BODIPY and vesicular filipin were quantified (n = 368 and 283) and normalized to the intensities in control cells. Bar graphs are presented as mean ± SD; p values were determined by Student’s t test. *p < 0.05, **p < 0.01, ***p < 0.001 (vs. WT). Scale bars, 5 μm.

