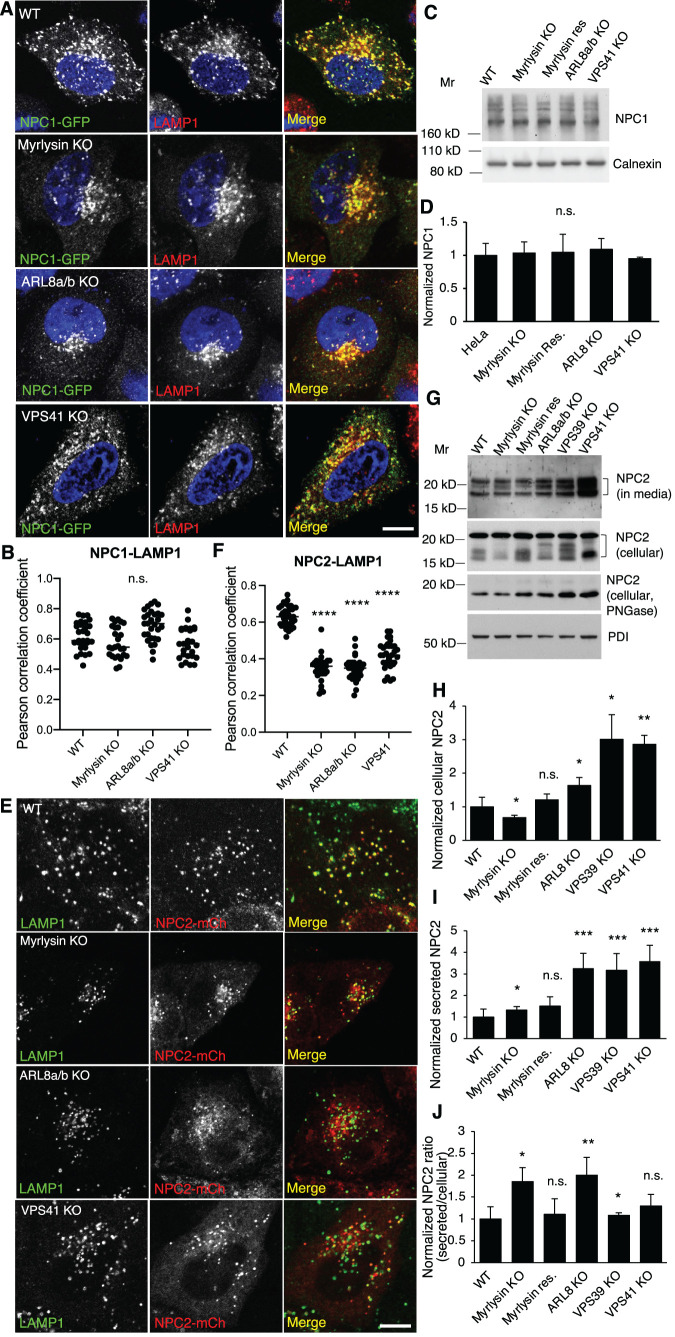
FIGURE 5:
Disruption of the BORC/ARL8/HOPS causes NPC2 mislocalization and increases NPC2 secretion. (A, B) WT and ARL8a/b-KO cells were transfected with a plasmid encoding NPC1-GFP. At 24 h posttransfection cells were fixed, immunostained for LAMP1, and imaged by fluorescence microscopy; 2330 cells in each group from three independent experiments were analyzed. NPC1-LAMP1 colocalization was quantified (n = 29, 26, 29, and 28) and presented as Pearson correlation coefficient. (C, D) Cell lysates were prepared from the indicated cells and subjected to SDS–PAGE and immunoblotting. Quantification was from three independent experiments. (E, F) The indicated cells were transfected with a plasmid encoding NPC2-mCherry, fixed at 24 h posttransfection, and stained with antibodies to mCherry and LAMP1. Fluorescence images were obtained by live-cell imaging with a confocal microscope. Cells in each group from three independent experiments were analyzed. NPC2-LAMP1 colocalization was quantified (n = 36, 31, 35, and 33) and presented as Pearson correlation coefficient. (G-J) Serum-free culture media were collected after 6 h incubation. Cells were recovered in complete media for 2 h and lysed to prepare cell lysates. Aliquots of cell lysates were treated with PNGase. Culture media, cell lysates, and PNGase-treated cell lysates from the indicated cells were subjected to immunoblotting. Multiple NPC2 bands were indicated with brackets. Quantification was from three independent experiments. Bar graphs are presented as mean ± SD; p values were determined by Student’s t test. *p < 0.05, **p < 0.01, ***p < 0.001, n.s., not significant (vs. WT). Scale bars, 5 μm.

