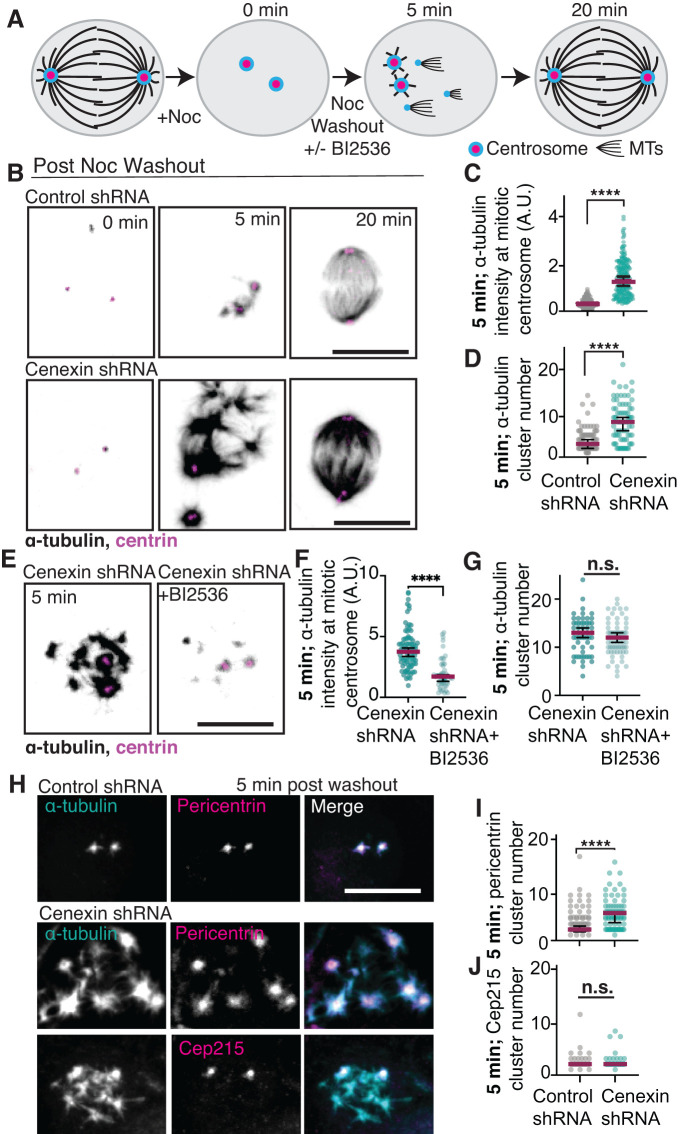
FIGURE 2:
Cenexin tempers MT nucleation by mediating pericentrin-associated acentrosomal nucleation sites. (A) Model of MT-renucleation assay. (B) Control and cenexin shRNA-treated HeLa cells are incubated with nocodazole, then washed with fresh media (washout). At 0 min, 5 min, and 20 min post washout, cells are fixed and immunostained for α-tubulin (inverted gray) and centrin (magenta). Scale bar, 10 μm. (C, D) Scatter plots of α-tubulin intensity at metaphase centrosomes (C) or α-tubulin cluster number (D) 5 min post nocodazole washout in control shRNA (gray) and cenexin shRNA (cyan) -treated cells. Mean (magenta) with 95% confidence intervals displayed. Unpaired, two-tailed Student’s t tests; ****, p < 0.0001. (E) Cenexin shRNA HeLa cells treated with or without the PLK1 inhibitor BI2536 at 5 min post nocodazole washout immunostained for α-tubulin (inverted gray) and centrin (magenta). Scale bar, 10 μm. (F, G) Scatter plots of α-tubulin intensity at metaphase centrosomes (F) or α-tubulin cluster number (G) 5 min post nocodazole washout. Mean (magenta) with 95% confidence intervals are displayed. Unpaired, two-tailed Student’s t tests; ****, p < 0.0001. (H) α-Tubulin (gray; cyan in merge), pericentrin (gray; magenta in merge), and Cep215 (gray; magenta in merge) metaphase cell projections 5 min post nocodazole washout. Scale bar, 10 μm. (I, J) Scatter plot depicting the number of pericentrin clusters (I) and Cep215 clusters (J) 5 min post nocodazole washout in control shRNA and cenexin shRNA cells. Mean (magenta) with 95% confidence intervals displayed. Unpaired, two-tailed Student’s t tests; ****, p < 0.0001; n.s., not significant. For graphs: statistical analysis in Supplemental Table S1. See Supplemental Figure S2.

