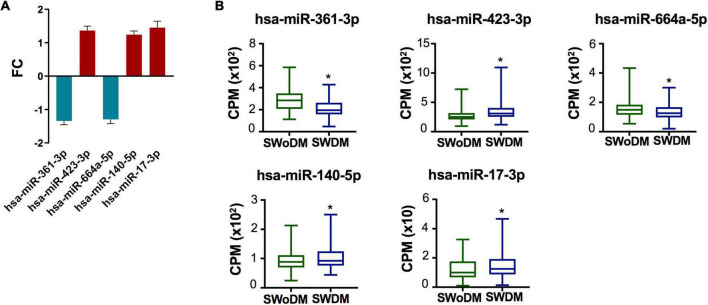
FIGURE 3.
Validated miRNAs in SWDM patients compared to SWoDM patients. (A) Column plot shows the fold change (FC) and standard error of the mean (SEM) of FDR-significant validated, differentially regulated miRNAs (n = 5) in SWDM versus SWoDM patients: downregulated in teal and upregulated in crimson color. (B) Box and whiskers plots show the difference in counts per million (CPM) of the five validated miRNAs in SWDM and SWoDM patients. Mean with minimum and maximum values, upper and lower quartiles, and statistical significance (P < 0.05) marked by an asterisk (*) are shown for each dataset.

