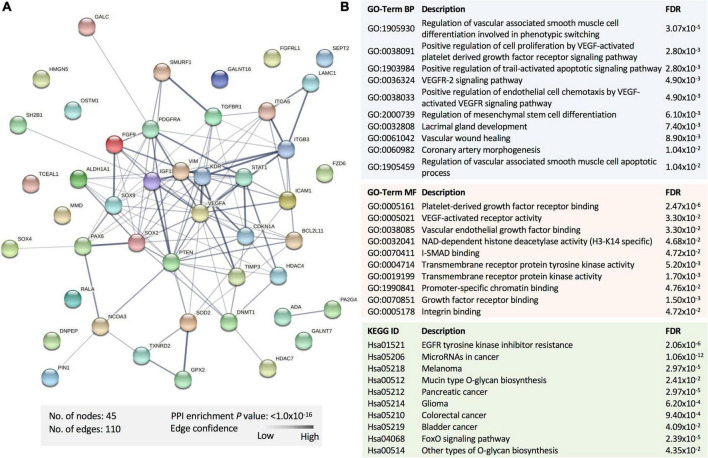
FIGURE 4.
Functional enrichment analysis of the proteins encoded by the gene targets of dysregulated miRNAs in SWDM versus SWoDM patients. (A) The protein–protein interaction (PPI) network generated for the 47 gene targets of the identified miRNA panel is shown. Network nodes represent proteins, while edges depict protein–protein associations. The key network statistics are also presented. (B) The top functional enrichment annotations from Gene Ontology (GO), biological process (BP)/molecular function (MF), and Kyoto Encyclopedia of Genes and Genomes (KEGG) pathways are listed.

