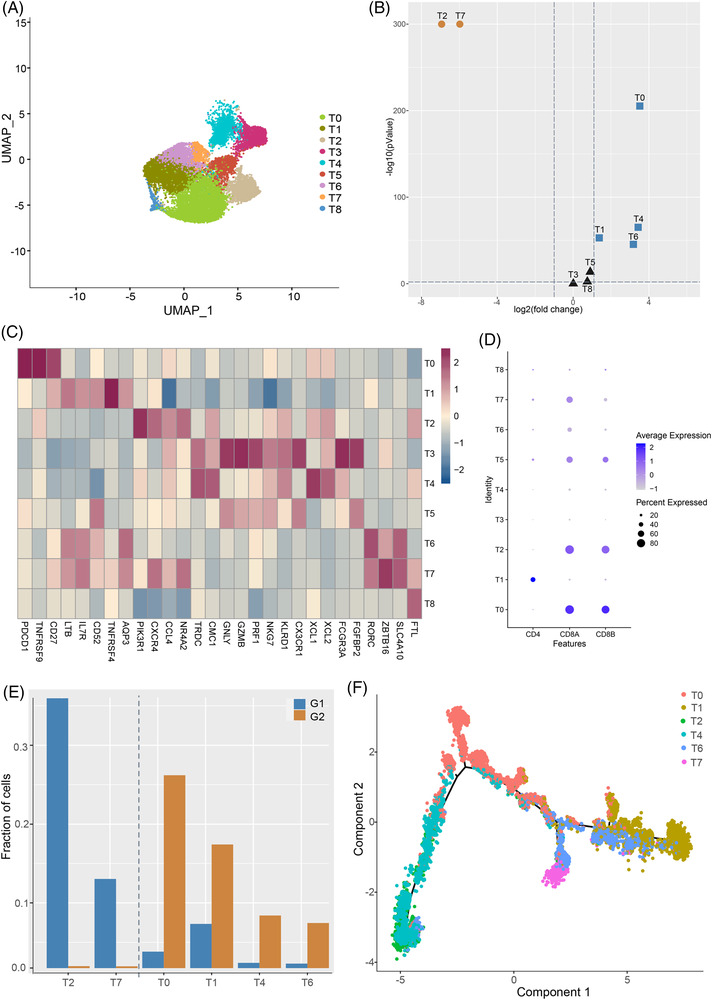
FIGURE 2.

Cell populations fluctuate as inflammation progresses. (A) UMAP plots of T cell subclusters. (B) Volcano plot illustrating fold change and p values for T cell subclusters, where circles in grey mean insignificant. (C) Heatmap showing marker genes of T cell clusters. (D) Dotplot showing the expression level of CD4, CD8A and CD8B in different T cell subsets. (E) Fraction of cells for the six differential T cell subclusters coloured by grade. (F) Developmental trajectory for differential T cell subclusters
