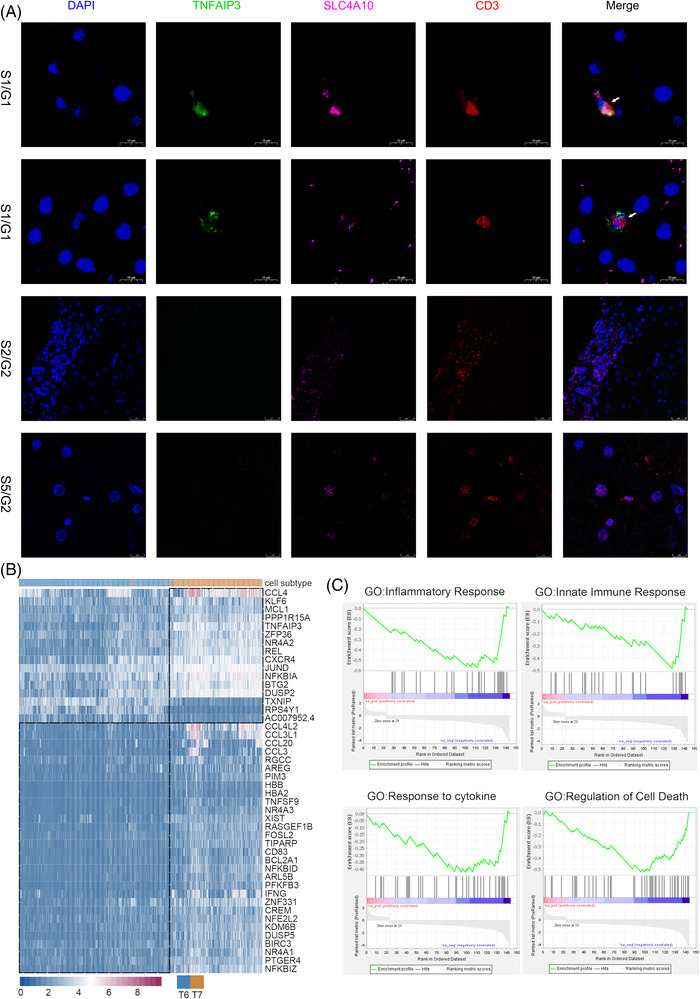
FIGURE 3.

Characteristics of two mucosal‐associated invariant T (MAIT) cell populations. (A) Immunofluorescence of genes CD3 (red), SLC4A10 (rose red), DAPI (blue) and TNFAIP3 (green) for liver biopsies obtained from samples S1 (grade G1), S2 (grade G2) and S5 (grade G2). (B) Heatmap of differential genes between two MAIT cell populations. (C) gene set enrichment analysis (GSEA) enriched terms for the genes differentially expressed between two MAIT cell populations
