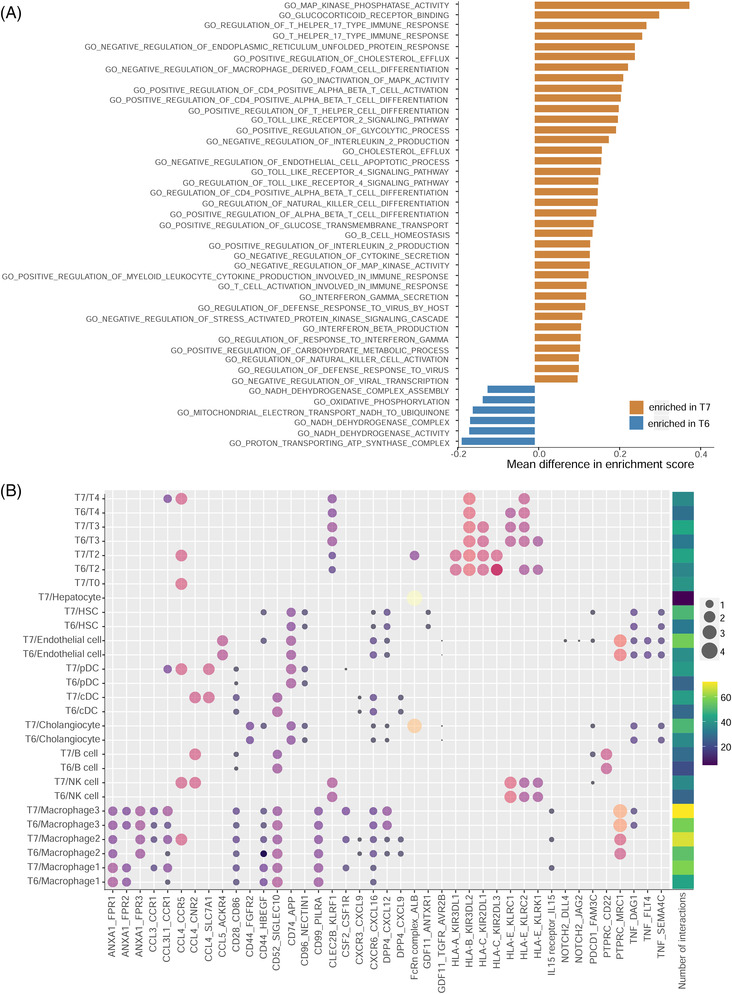
FIGURE 4.

Gene set variation analysis (GSVA) and cross‐talk among T cell subclusters. (A) Variation of pathways for two mucosal‐associated invariant T (MAIT) cell populations using GSVA. (B) The number of interactions and ligand‐receptor pairs between MAIT cell subclusters (T7, T6) and others
