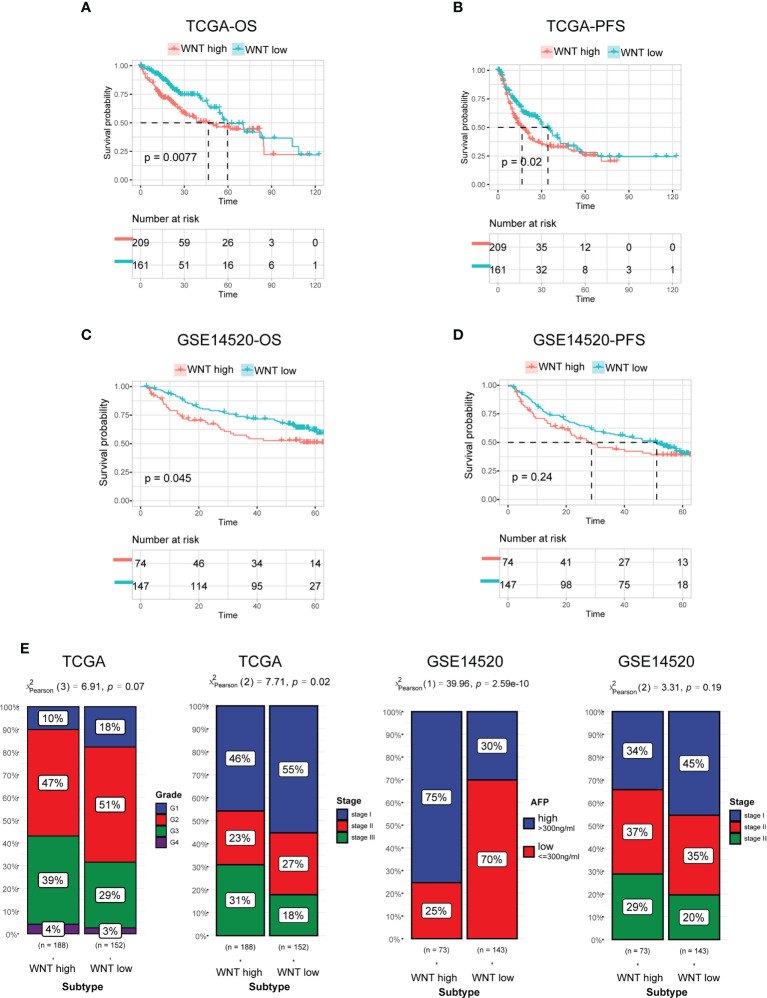
Figure 2.
Prognosis and clinicopathologic characteristics between the Wnt subtypes. (A, B) Kaplan−Meier curves for patients with HCC classified into WNT-low and -high subtypes in TCGA in terms of OS (A) and PFS (B). (C, D) Validation of Kaplan−Meier curves in the GEO dataset in terms of OS (C) and PFS (D). (E) Bar plot presenting the clinicopathologic features of these subtypes.

