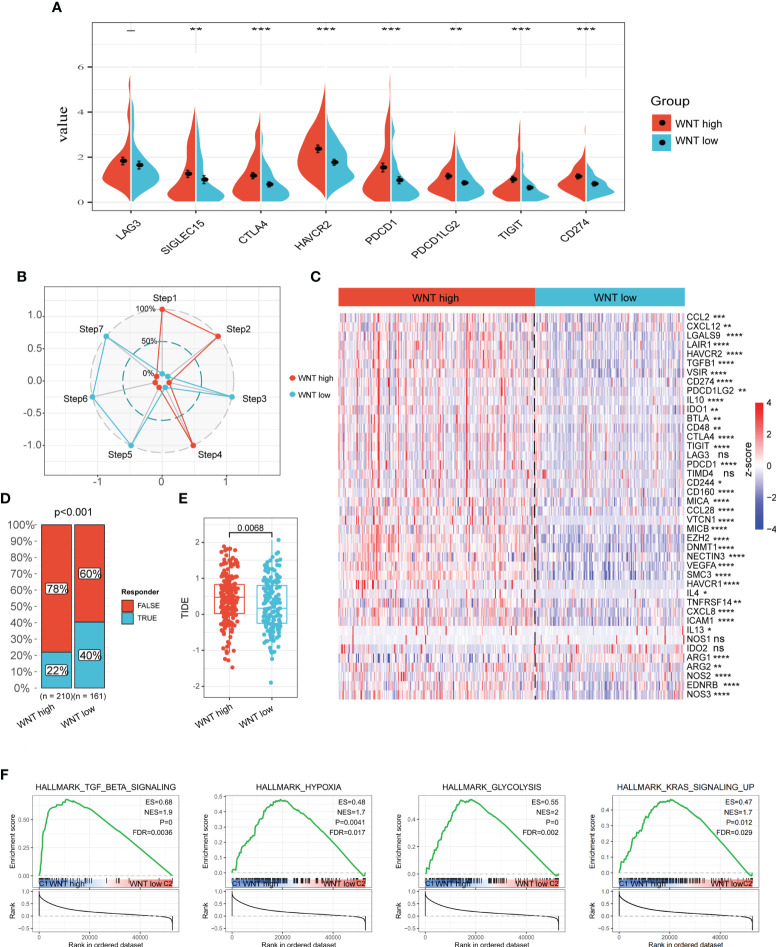
Figure 4.
WNT-high subtypes are associated with the immune suppressive tumor microenvironment. (A) Violin plots of immune checkpoint expression. (B) Estimated score of the seven-step cancer-immunity cycle. (C) Heatmap of gene expression associated with the negative regulation of the immune processes. (D) Bar plot of ICB response rate. (E) Box plot of TIDE score. (F) GSEA plot of the underlying biological processes associated with WNT subtypes. (ns, p > 0.05; *, p < 0.05; **, p < 0.01; ***, p < 0.001; ****, p < 0.0001).

