FIGURE 6.
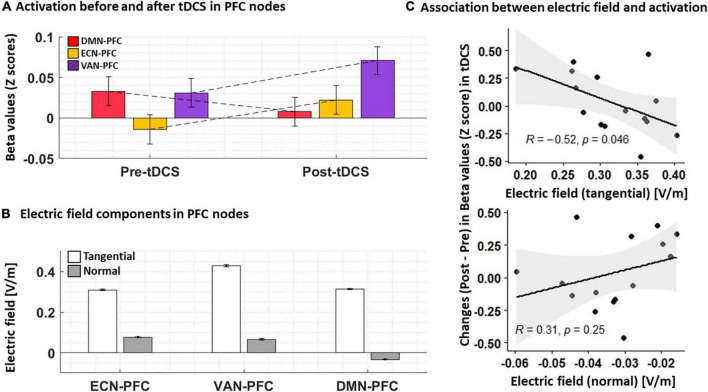
(A) Functional activation before and after tDCS. Normalized beta values (Z score) obtained from first-level general linear models for each individual in PFC nodes are visualized pre- and post-tDCS. (B) Electric field components. Tangential and normal components of the electric fields in PFC nodes are extracted for each individual. (C) Association between changes in neural activation and electric fields. A Scatter plot for the PFC node in DMN showed a significant correlation between changes in neural activation and the tangential component of the electric field. Bars show average values, and error bars indicate standard errors.

