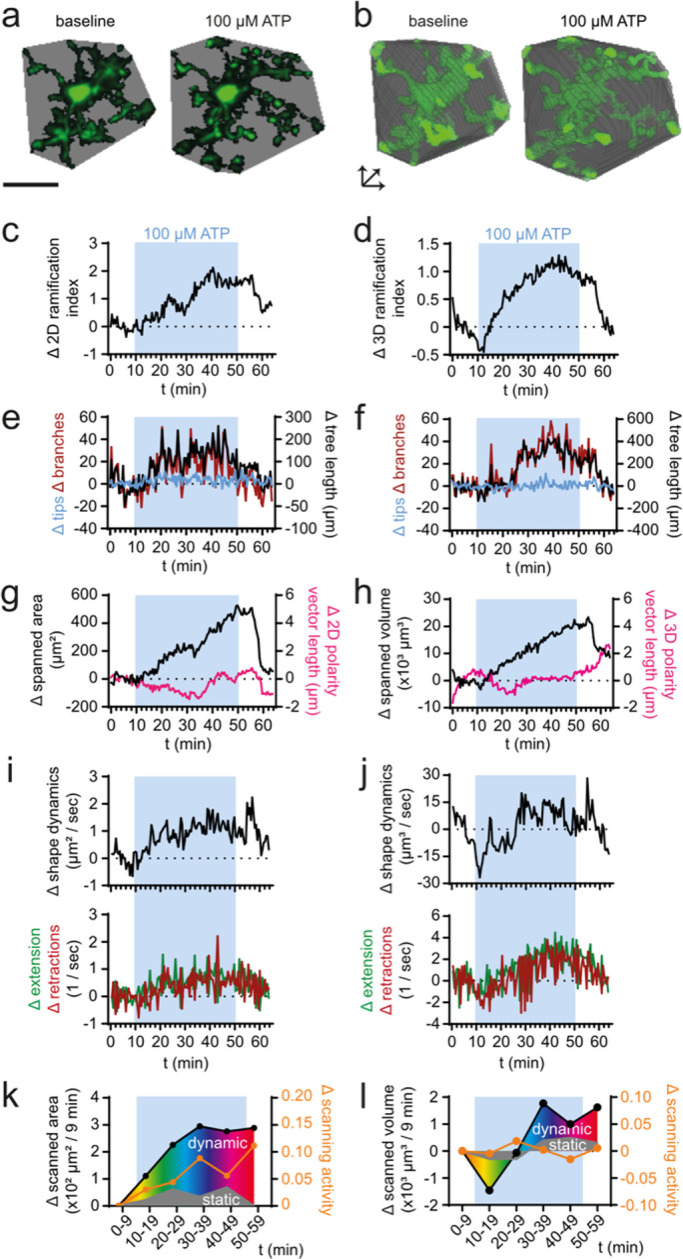
FIGURE 3:

Analysis of ex vivo two-photon microscopy data. 2D and 3D analysis of microglial morphology and dynamics in ex vivo two-photon microscopy data of a representative microglial cell in acute cerebral slices of CX3CR1EGFP/wt mice before and after perfusion with 100 µM ATP (blue boxes). (a, b) Spanned area (2D) or volume (3D) before (t = 5 min) and during (t = 45 min) ATP perfusion. (c, d) Ramification index, (e, f) tree length, number of tips, and number of branches, (g, h) spanned area (2D) or volume (3D), cell polarity vector length, (i, j) shape dynamics, number of extensions and retractions, and (k, l) scanned area (2D) or volume (3D) during ATP perfusion. Scale bar, 20 µm.
