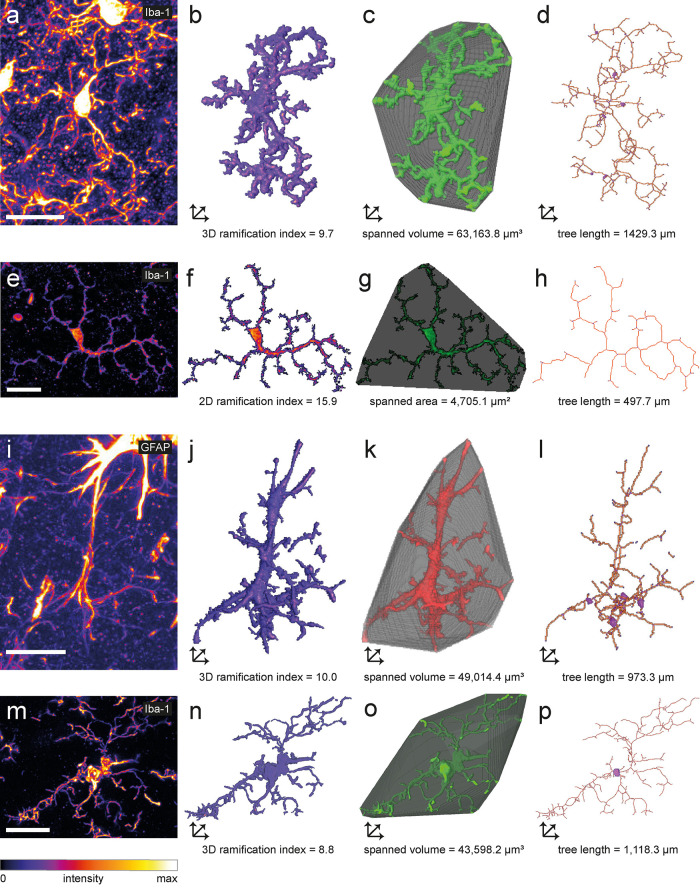
FIGURE 4:
Analysis of cellular morphology in tissue sections. Maximum-intensity projections of confocal z stacks of an (a) Iba1-labeled murine cortical microglial cell, (e) Iba1-labeled murine retinal microglial cell, (i) hippocampal GFAP-labeled murine astrocyte, and (m) Iba1-labeled human microglial cell. 2D or 3D images of (b, f, j, n) reconstructed cell, (c, g, k, o) spanned volume (3D) or spanned area (2D), and (d, h, l, p) cell skeleton illustrating selected morphology parameters of a, e, i, and m analyzed with MotiQ. Scale bars, 20 µm.

