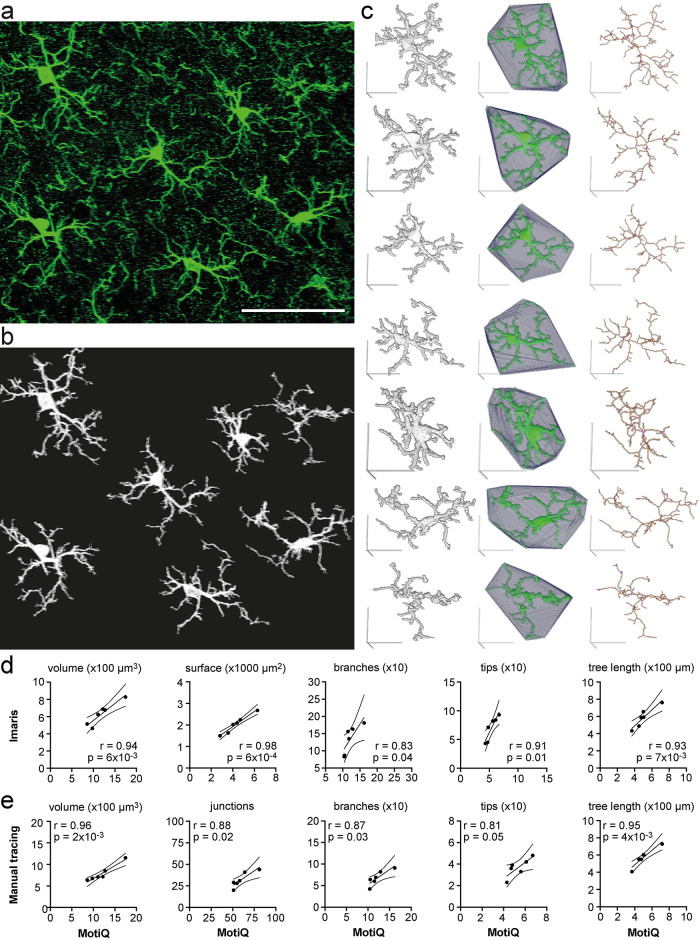
FIGURE 5:
Fully automated analysis of cellular morphology in tissue sections. (a) Maximum-intensity projection of a confocal z stack of Iba1-labeled murine cortical microglia. Scale bar, 50 µm. (b) Maximum-intensity projection of automatically detected cells after analyzing (a) with MotiQ 3D analyzer (using a high size threshold [of 10,000 voxels] to reconstruct cells that are moreover complete in the stack). (c) MotiQ visualizations of each cell: reconstructed cell (left), spanned volume (middle), and cell skeleton (right). Scale bars, 20 µm. (d, e) Direct comparison of the results obtained with MotiQ (c) to results obtained using (d) an alternative automated approach based on the commercial software Imaris or (e) a manual approach using the Fiji plug-in Simple Neurite Tracer (Arshadi et al., 2021). Each data point represents one cell. MotiQ results are indicated on the x-axis. Imaris (d) or manual tracing (e) results are indicated on the y-axis. Lines show mean and 95% confidence interval of a linear regression. r and p values for a Pearson correlation are indicated. Note: Imaris and the manual approach did not allow detection of the top right cell in the image (a), as the cell body is not completely within the stack. Thus, this cell is missing in the correlations.

