FIGURE 7:

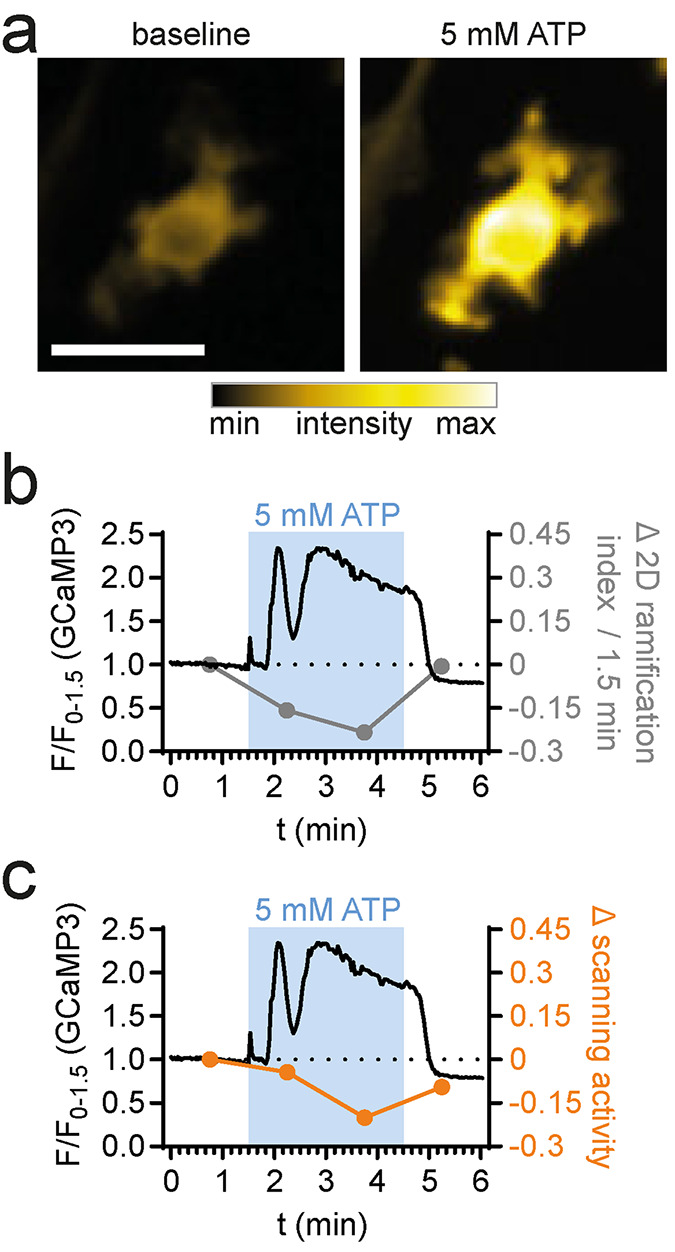
Correlative analysis of morphology, dynamics, and fluorescence kinetics in cultured macrophages. MotiQ 2D analysis of epifluorescent time-lapse images of a 2D-cultured bone marrow–derived macrophage, expressing the genetically encoded calcium sensor GCaMP3. (a) False-colored fluorescence intensity images before and during perfusion with ATP (5 mM). Calcium signals were recorded for 90 s before perfusion with ATP (180 s) and washout. (b, c) Upon ATP perfusion, a calcium signal was detected and temporally correlated to changes in the cell’s (b) 2D ramification index and (c) scanned area. Scale bar, 20 µm.
