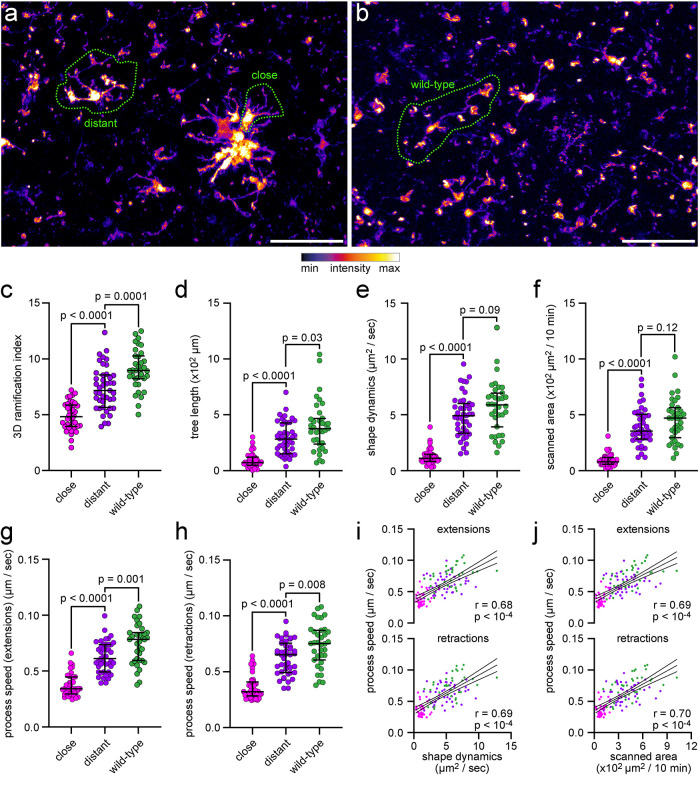
FIGURE 8:
Analysis of microglial morphology and dynamics in a cerebral amyloidosis mouse model of AD. Analysis of microglial morphology and dynamics in ex vivo two-photon microscopy data of microglia in acute cerebral slices of APP/PS1 CX3CR1EGFP/wt mice or wild-type CX3CR1EGFP/wt. (a, b) Maximum-intensity projection of images from (a) APP/PS1 CX3CR1EGFP/wt mice or (b) wild-type CX3CR1EGFP/wt mice. Scale bar, 50 µm. (c) Ramification index and (d) tree length, determined by MotiQ 3D analysis. (e) Shape dynamics and (f) scanned area, determined by MotiQ 2D analysis. (g–j) To verify the parameter results for shape dynamics and scanned area, for each analyzed cell, all visible processes were also manually tracked in 2D. Based on this tracking, for each cell, the average process speed of (g) process extensions or (h) retractions was determined. (i, j) Correlation of the manually determined process speeds with the MotiQ results shape dynamics (i, shape dynamics plotted alone in e) and scanned area (j, scanned area plotted alone in f). Bar plots (c–h) show the median ± interquartile range; individual data points represent individual cells (n = 3 animals per group; close: 9–14 cells per animal, distant: 14–17 cells per animal, wild type: 10–13 cells per animal); p values for a two-sided Mann–Whitney test are indicated. Data points in (i) and (j) also represent individual cells and are colored as in (c–h). Magenta: plaque-close cells. Purple: plaque-distant cells. Dark green: wild-type cells. Lines show mean and 95% confidence interval of a linear regression. r and p values for a Pearson correlation are indicated.

