FIGURE 5:
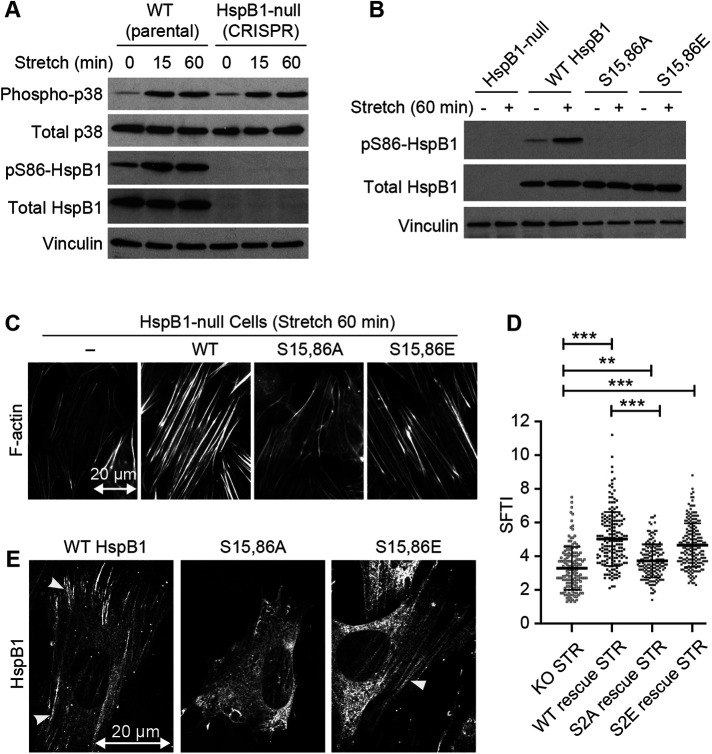
Uniaxial cyclic stretch elicits actin remodeling in cells that express WT but not S15,86A HspB1. (A) Western immunoblot analysis of stretch-stimulated (15%, 0.5 Hz, 15 and 60 min) WT and HspB1-null cells. Phospho-p38 and PhosphoS86-HspB1 antibody signals are above the corresponding total antibody signals and a vinculin loading control. (B) Immunoblot analysis of unstretched and stretch-stimulated (15% 0.5 Hz 60 min) HspB1-null cells and cells expressing the rescue constructs for WT; S15,86A; and S15,86E HspB1s. PhosphoS86-HspB1 is elevated in stretch-stimulated WT HspB1 and is not detectable in the phosphomutant HspB1s, although they are all comparably expressed as detected by Total HspB1 antibody. Vinculin is shown as loading control. Immunoblot quantification is included in Supplemental Table S1. (C) Phalloidin-stained stretch-stimulated (15% 0.5 Hz 60 min) HspB1-null cells and cells expressing the rescue constructs for WT; S15,86A; and S15,86E HspB1s. Reorientation of actin perpendicular to the stretch vector (20 µm double-headed arrow) is maintained but actin thickening is variable. (D) Graph of SFTI measurements on the phalloidin-stained cells show the most robust actin SFs in cells expressing the WT and phosphomimetic S15,86E HspB1. Actin response between HspB1-null cells and cells expressing the nonphosphorylatable S15,86A HspB1 was similar. Graphs are mean with standard deviations and unpaired t tests were used to determine p values of **p < 0.01, ***p < 0.001. (E) Confocal microscopy of HspB1 immunolocalization in stretch-stimulated HspB1-null cells expressing WT; S15,86A; and S15,86E HspB1s. Cytoskeletal distribution of HspB1 is detectable in WT and S15,86E HspB1 (arrowheads) but not with S15,86A HspB1. In this imaging data set HspB1 cytoskeletal distribution was detected in 53% WT rescue cells (20/38), 10% S15,86A rescue cells (2 possible/20), and 47% S15,86E rescue cells (8/17). Double-headed arrow of 20 micron scale shows uniaxial stretch vector in the horizontal direction.

