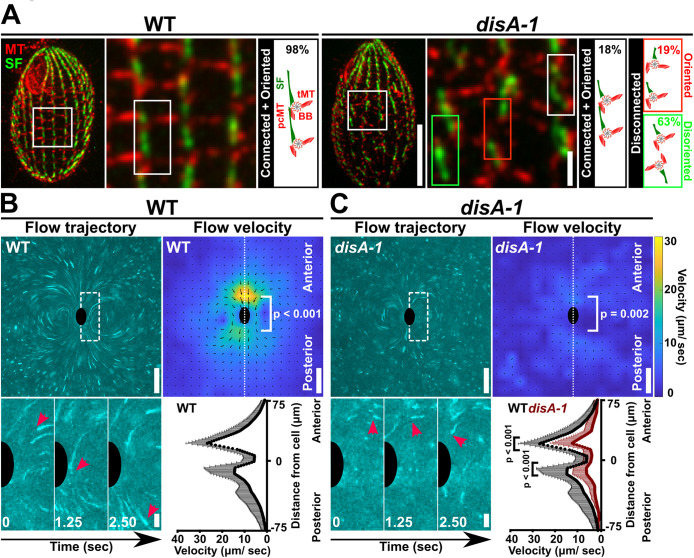
FIGURE 3:
BB connections and orientation are required for cilia-dependent fluid flow. (A) Fluorescent images depicting the cortical organization of WT and disA-1 cells at 25°C. Most disA-1 cells display BB disconnection (82%). Disconnected disA-1 bodies are either oriented (19% of total) or disoriented (63% of total). Microtubule (MT), red; SF, green. Scale bars, 10 and 2 µm. (B) BB connections are required for normal fluid flow movements and velocity at 25°C. Fluid flow is assessed by tracking fluorescent beads in media. Fluid flow trajectories are depicted as time-projected images over 2.5 s (100 frames). Inset (white box with dashed line) illustrates the movement of a fluorescent bead (red arrowheads) relative to the cell (black half oval). Fluid flow velocity is represented as heatmaps. Cooler colors indicate slower fluid flow, while warmer colors indicate faster fluid flow. The predicted cell position is marked by a black oval. (C) disA-1 disrupts fluid flow velocity at 25°C. Inset (white box with dashed line) illustrates the movement of a fluorescent bead (red arrowheads) relative to the cell (black half oval). WT (black line): n = 9 cells. disA-1 (brown line): n = 13 cells. Mann–Whitney test. Mean ± SD. Scale bars, 50 µm (full field of view) and 10 µm (inset).

