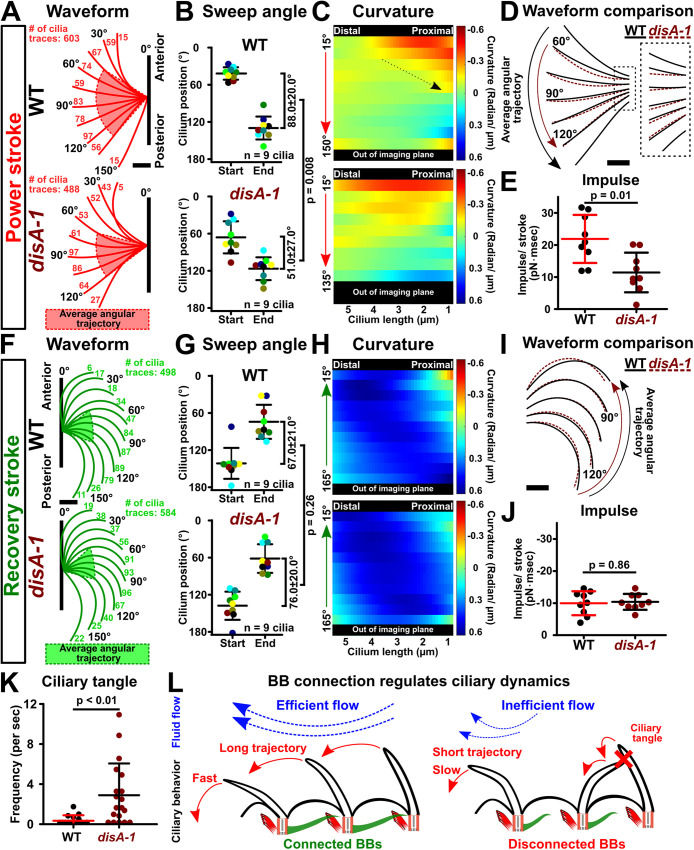
FIGURE 5:
BB connections support ciliary waveform and coordination. (A) Tetrahymena power stroke waveform. Top panel: Average WT power stroke waveform. Bottom panel: Average disA-1 power stroke waveform. Red highlight indicates the average angular trajectory (n = 9 cilia). Cilium position is defined by the angle from the cilium distal end (4.5 µm up from the cilium base) relative to the cell’s AP axis. Angles are categorized into 15° bins. Each angular bin contains at least 1% of all ciliary traces per condition. The number of cilia traces for each bin is indicated. (B) Angular trajectories of WT and disA-1 cilia during the power stroke. disA-1 cilia undergo shorter trajectories than WT cilia. Each cilium in the analysis is color coded. (C) Curvature heatmaps of WT and disA-1 cilia through the power stroke (blue: the cilium bends toward the cell anterior pole; red: the cilium bends away from the cell anterior pole; green: straight cilium). The Y-axis marks the cilium position through the power stroke. Dotted arrow indicates the change in WT cilium curvature at the start to middle of the power stroke. WT power stroke: n = 603 cilia traces (nine cilia, six ciliary beat cycles each, nine cells). disA-1 power stroke: n = 488 cilia traces (nine cilia, six ciliary beat cycles each, nine cells). (D) Superimposed WT (black lines) and disA-1 (brown dashed lines) average power stroke waveform. Curvature differences are depicted only for stages of the power stroke that fall within the average angular trajectories of WT and disA-1 cilia. (E) Ciliary power stroke impulses were estimated using RFT. WT cilia exert greater impulse (area under the force-time curve) than disA-1 cilia along the AP axis per power stroke (n = 9 cilia). (F) Tetrahymena recovery stroke waveform. Top panel: Average WT recovery stroke waveform. Bottom panel: Average disA-1 recovery stroke waveform. Green highlight indicates the average angular trajectory (n = 9 cilia). Cilium position is defined by the angle from the cilium distal end (4.5 µm up from the cilium base) relative to the cilium’s power stroke axis. Angles are categorized into 15° bins. Each angular bin is at least 1% of all ciliary traces per condition. The number of cilia traces for each bin is indicated. (G) Angular trajectories of WT and disA-1 cilia. Each cilium in the analysis is color coded. disA-1 cilia undergo trajectories comparable to those of WT cilia during the recovery stroke. (H) Curvature heatmaps of WT and disA-1 cilia through the recovery stroke (blue: the cilium bends toward the cell anterior pole; red: the cilium bends away from the cell anterior pole; green: straight cilium). The Y-axis marks the cilium position through the recovery stroke. WT recovery stroke: n = 498 cilia traces (nine cilia, six ciliary beat cycles each, nine cells). disA-1 recovery stroke: n = 584 cilia traces (nine cilia, six ciliary beat cycles each, nine cells). (I) Superimposed WT (black lines) and disA-1 (brown dashed lines) average recovery stroke waveform. Curvature differences are depicted only for stages of the recovery stroke that fall within the average angular trajectories of WT and disA-1 cilia. (J) Ciliary recovery stroke impulses were estimated using RFT. WT and disA-1 cilia exert comparable impulses (area under the force-time curve) along the AP axis per recovery stroke (n = 9 cilia). (K) Frequency of ciliary tangles. WT: n = 11 cells (14 cilia pairs); disA-1: n = 13 cells (19 cilia pairs). (L) Schematic illustrates the model that BB connections promote fast and long power stroke trajectories for coordinated ciliary beating and effective fluid flow propulsion. Scale bars, 1 µm.

