FIGURE 3:
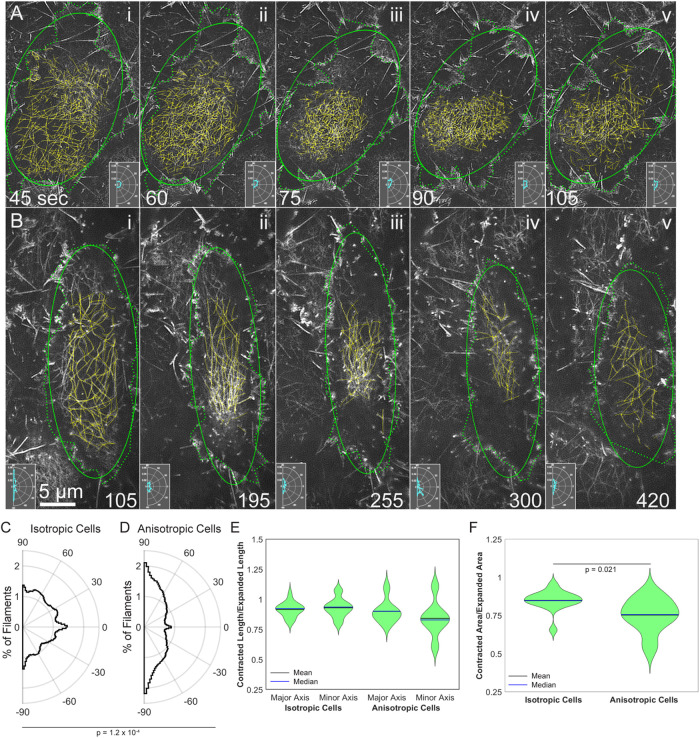
Actin filament array condensation and relaxation parallels amnioserosa cell contraction and expansion in (A) an isotropically and (B) an anisotropically contracting cell. F-actin labeled with (A) GFP-MoeABD from Supplemental Movie 1 or (B) Lifeact-mEGFP from Supplemental Movie 2. Dotted green lines—outline of cells based on the position of lamellipodia and filopodia. Solid green ellipse—depicts an ellipse fitted to the cell outline. Yellow lines—manual traces of individual actin filaments. Polar histogram insets depict the orientation of traced actin filaments. (C) Average distribution of filament orientation in six isotropic cells from four embryos. (D) Average distribution of filament orientation in six anisotropic cells from four embryos. The distributions shown in C and D are significantly different with a p = 0.00012. (E) Ratio of contracted axis length to expanded axis length in isotropic and anisotropic cells; n = 15 contractions from the six isotropic cells traced and n = 7 contractions from the six anisotropic cells traced. (F) Ratio of contracted area to expanded area in isotropic and anisotropic cells; n = 15 contractions from the six isotropic cells traced and n = 7 contractions from the six anisotropic cells traced. Anisotropic cells showed a greater reduction in area with p = 0.021. Time is in seconds from the start of imaging. Animated versions of F-actin dynamics are shown in Supplemental Movies 6 and 7 for an isotropic and anisotropic cell, respectively.

