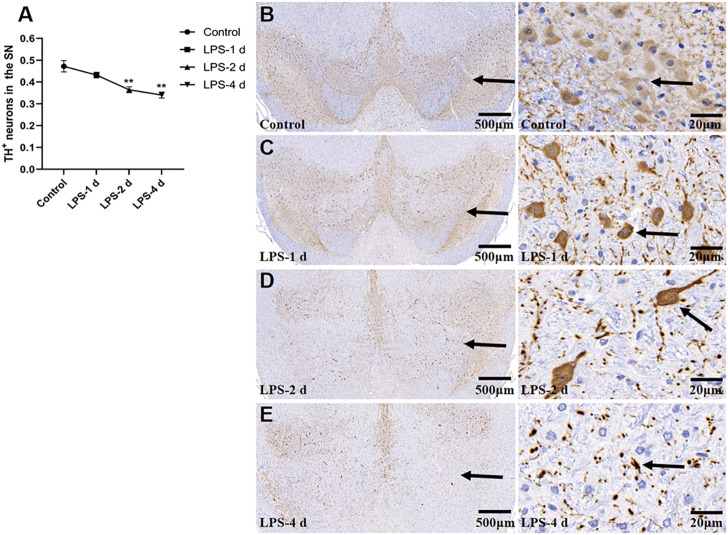
FIGURE 10.
Tyrosine hydroxylase (TH)+ neurons in the SN for all groups (n = 3). (A) The AOD value of each group was compared. Data are expressed as the mean ± SEM. **p < 0.01, compared to the control group. (B) Representative photomicrographs of TH+ neurons in the control group (Left: ×16, Right: ×400). (C) Representative photomicrographs of TH+ neurons in the LPS-1 d group (Left: ×16, Right: ×400). (D) Representative photomicrographs of TH+ neurons in the LPS-2 d group (Left: ×16, Right: ×400). (E) Representative photomicrographs of TH+ neurons in the LPS-4 d group (Left: ×16, Right: ×400). The arrows showed the expression of TH+ neurons.

