FIGURE 3.

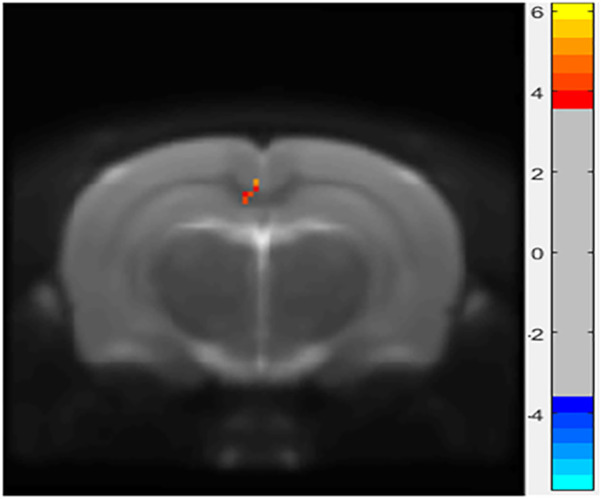
Differences in amplitude of low-frequency oscillations (ALFF) between the control and LPS-4 d groups. The statistical threshold was set at cluster size > 6, which corresponds to a corrected p < 0.005.

Differences in amplitude of low-frequency oscillations (ALFF) between the control and LPS-4 d groups. The statistical threshold was set at cluster size > 6, which corresponds to a corrected p < 0.005.