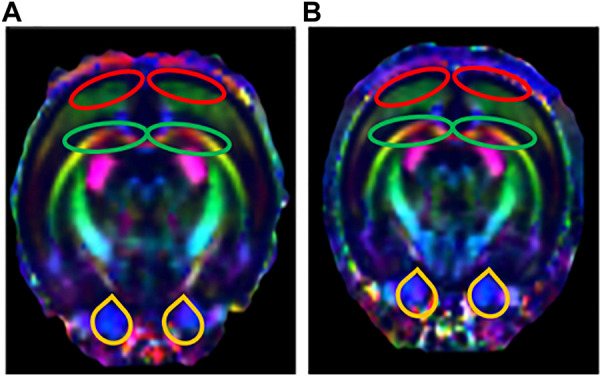
FIGURE 7.

Tracing of nerve fibers (n = 6). The direction of travel: blue, rostral to caudal; Green, dorsal and ventral; Red, left and right. (A) Tracing of nerve fibers in the control group. (B) Tracing of nerve fibers in the LPS-4 d group. The red outlines indicated the prefrontal cortex (PFC), the green outlines indicated the hippocampus (HIP), and the yellow outlines indicated the ventral tegmental area (VTA).
