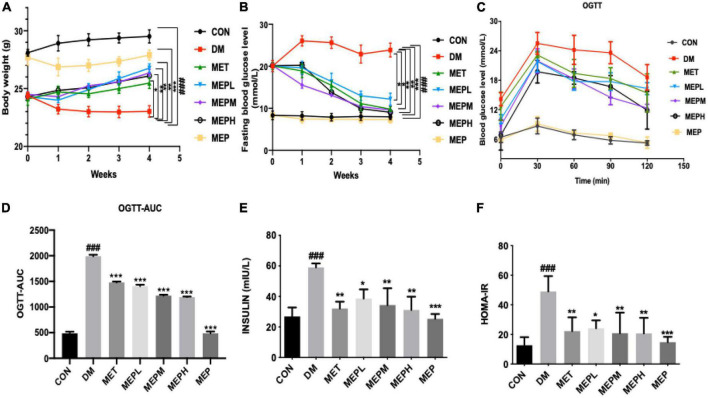
FIGURE 3.
(A) The bodyweight of mice was measured daily during MEP treatment (B) FBG level, (C) OGTT, (D) The trapezoidal rule was used to calculate the AUC of OGTT, (E) serum insulin level, and (F) HOMA-IR was measured after T2DM treatment with MEP in different groups. # indicates a significant difference compared with the control group. ###p < 0.001 vs. control. *indicates significant difference compared with DM group. *p < 0.05, **p < 0.01 and ***p < 0.001 vs. DM. Data were presented as mean ± standard error of mean (SEM).

