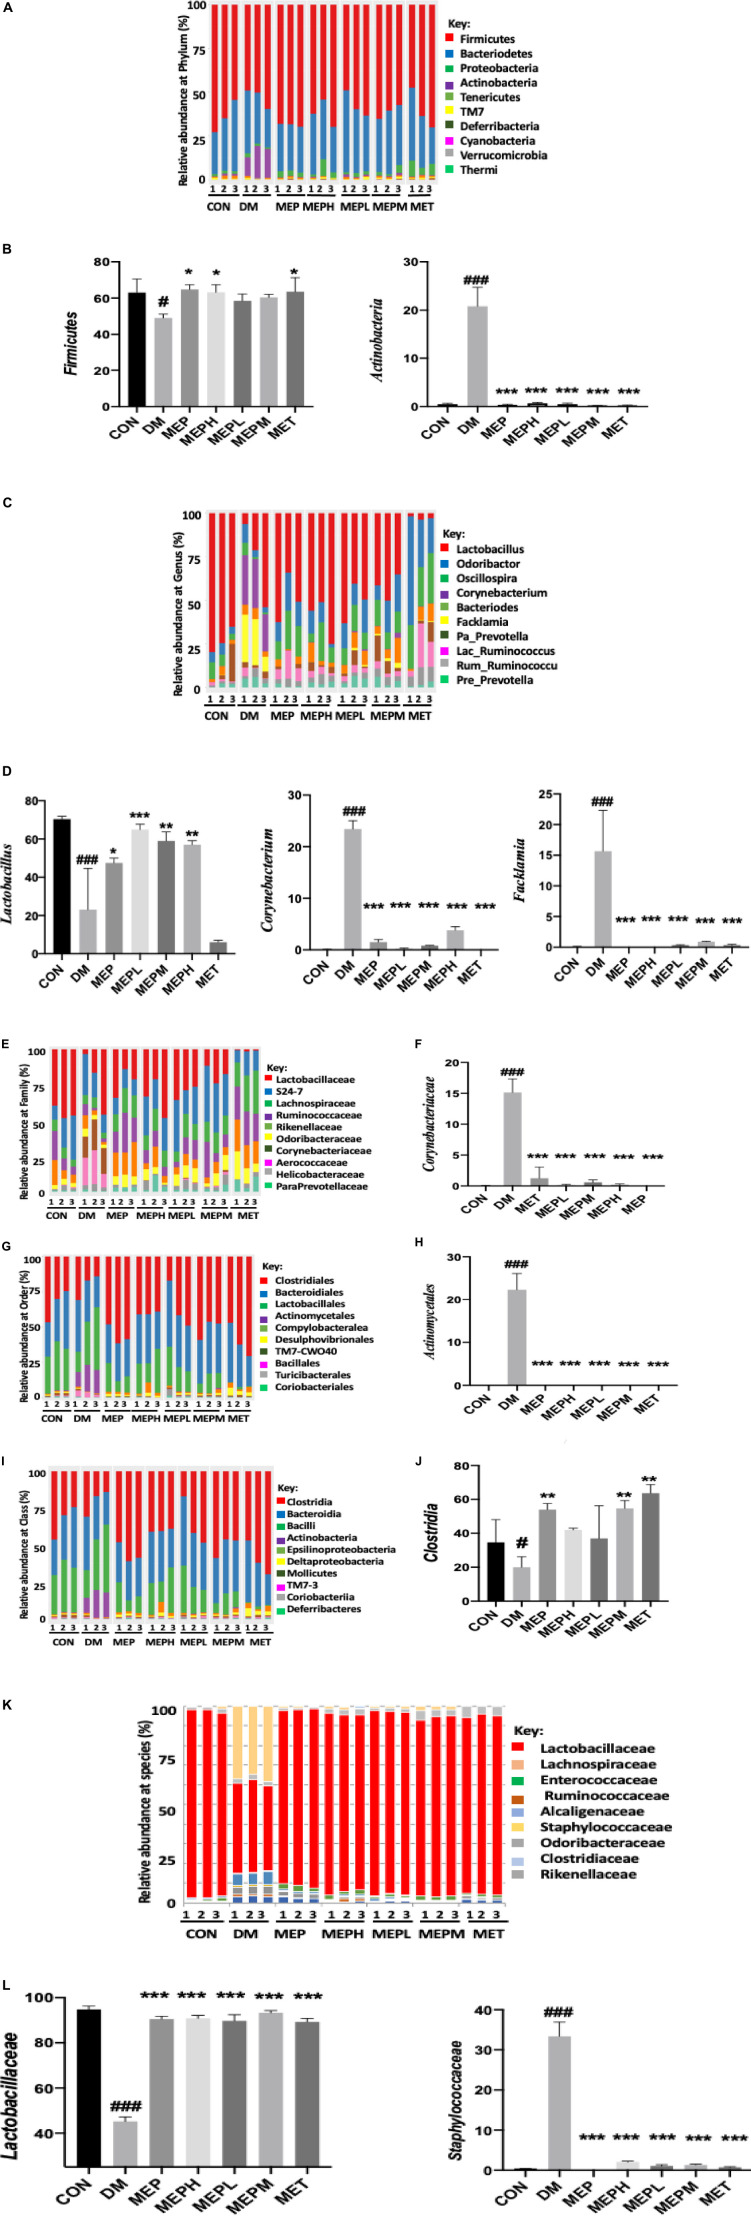
FIGURE 5.
Different taxonomic levels of microbial composition in T2DM mice. (A) Relative abundance at the phylum level, (B) Abundant flora at the phylum level (%), (C) Relative abundance at the genus level, (D) Abundant flora at the genus level (%), (E) Relative abundance at the family level, (F) Abundant flora at the family level (%), (G) Relative abundance at the order level, (H) Abundant flora at the order level (%), (I) Relative abundance at the class level, (J) Abundant flora at the class level (%), (K) Relative abundance at the species level, and (L) Abundant flora at the species level (%). # indicates a significant difference compared with control (CON) group. #p < 0.05, and ###p < 0.001 vs. Control. * indicates a significant difference compared with the DM group. *p < 0.05, **p < 0.01, and ***p < 0.001 vs. DM.

