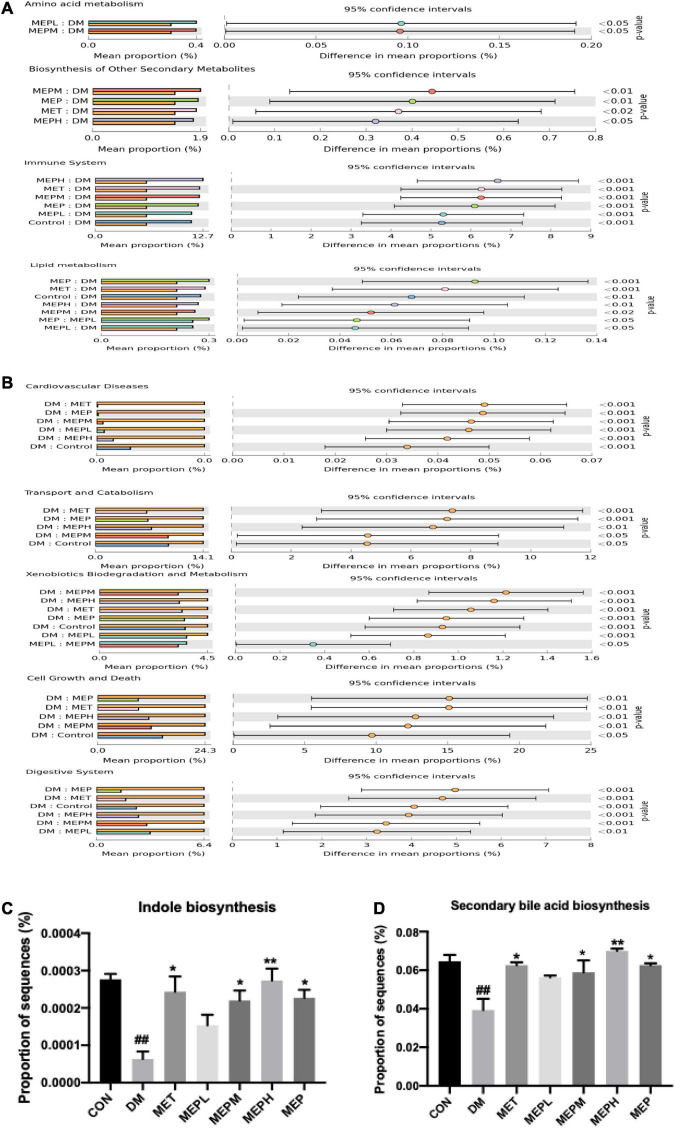
FIGURE 6.
Functional profile analysis of gut metabolites in T2DM mice. (A,B) COG (Clusters of Orthologous Groups) shows the metabolic pathways functional predictions and KEGG database level 3 indicated with their confidence interval ratio of differences, while p-value shows on the right side among different groups. (C) Expression of genes involved in indole biosynthesis and (D) Secondary bile acid biosynthesis. # indicates a significant difference compared with control (CON) group. ##p < 0.01 vs. Control. * indicates a significant difference compared with the DM group. *p < 0.05, **p < 0.01 vs. DM.

