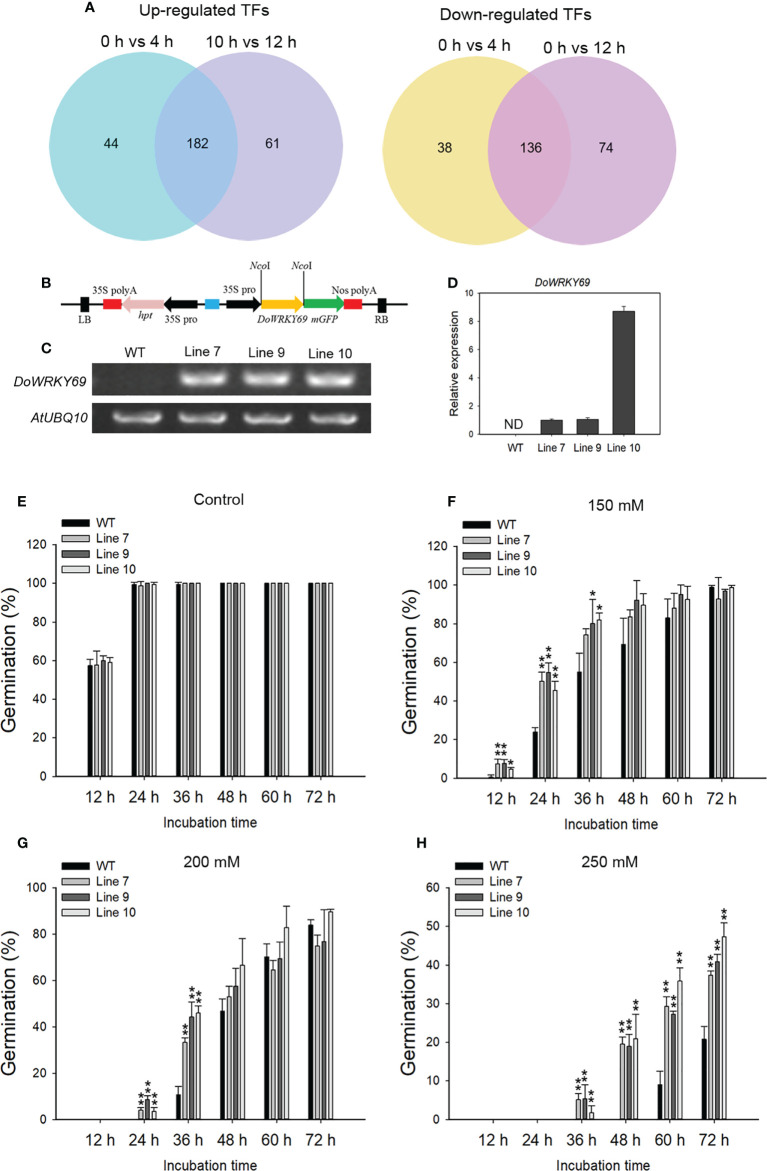
Figure 10.
Identification of NaCl-induced TFs and characterization of one WRKY gene in the salt stress response. (A) Venn diagram of up-regulated TFs (left) and down-regulated TFs (right) from 0 h vs 4 h and 0 h vs 12 h comparisons. (B) The overexpression vector containing the DoWRKY69 gene is shown. Analysis of the expression of the DoWRKY69 gene in wild-type (WT) and 35S::DoWRKY69 lines by using RT-PCR (C) and qRT-PCR (D). (E) Germination of WT and 35S::DoWRKY69 lines in the control (without NaCl), 150 mM NaCl (F), 200 mM NaCl (G) and 250 mM NaCl (H). Bars indicate means ± standard deviation of thee replicates. *, ** indicate significant differences at P < 0.05 and P < 0.01, respectively, according to the Dunnett test. About 60 seeds of each genotype were used.

