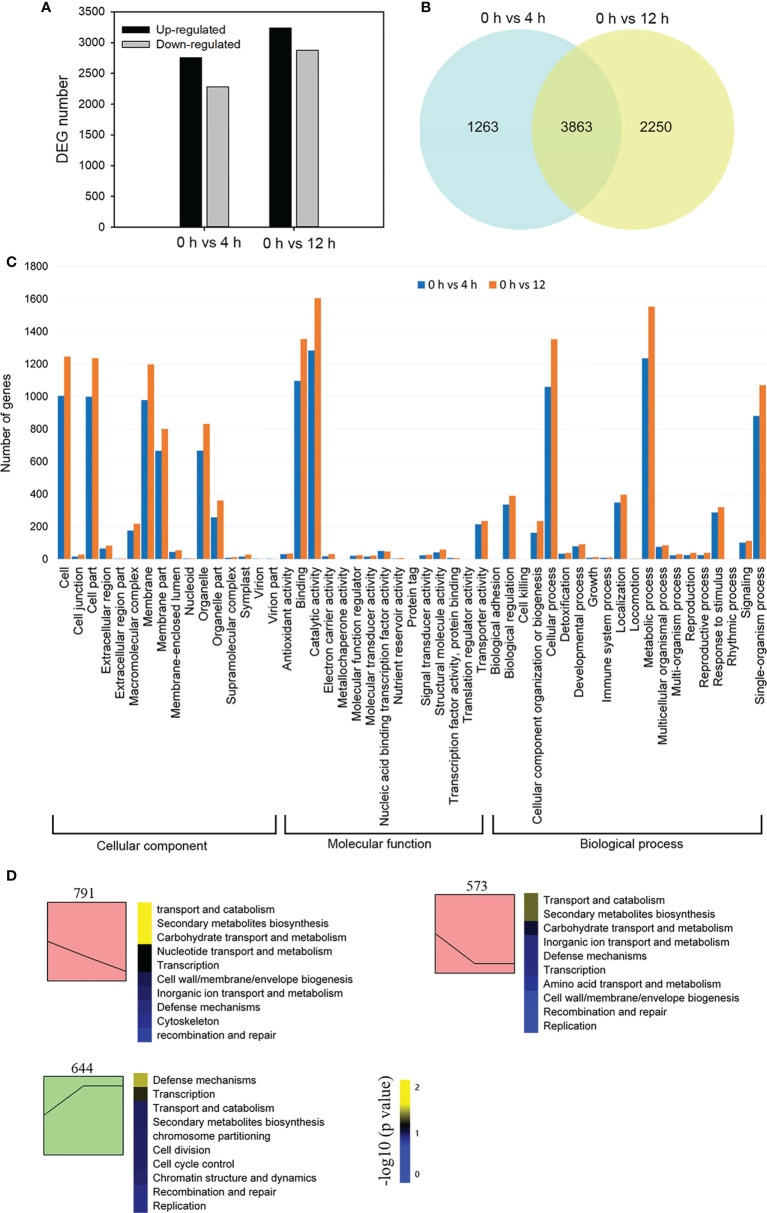
Figure 2.
Transcriptome sequencing analysis of Dendrobium officinale plantlet roots after salt treatment. (A) Analysis of differentially expressed genes (DEGs) in response to salt tress. DEGs were generated by 0 h vs 4 h and 0 h vs 12 h comparisons. (B) Venn diagram showing shared DEGs from the 4 h and 12 h comparison after salt stress. (C) Gene ontology analysis of DEGs. (D) All DEGs were subjected to STEM clustering analysis.

